Page 353 - Applied Statistics And Probability For Engineers
P. 353

c09.qxd  5/15/02  8:02 PM  Page 301 RK UL 9 RK UL 9:Desktop Folder:


                                         9-3 TESTS ON THE MEAN OF A NORMAL DISTRIBUTION, VARIANCE UNKNOWN  301


                                   normal. The important result upon which the test procedure relies is that if X , X , p , X is a
                                                                                                 1
                                                                                                          n
                                                                                                   2
                                                                                            2
                                   random sample from a normal distribution with mean   and variance   , the random variable
                                                                        X
                                                                    T
                                                                        S
 1n
                                   has a t distribution with n 
 1 degrees of freedom. Recall that we used this result in Section
                                   8-3 to devise the t-confidence interval for  . Now consider testing the hypotheses

                                                                    H :      0
                                                                     0
                                                                    H :      0
                                                                     1
                                   We will use the test statistic
                                                                        X 
  0
                                                                   T                                     (9-23)
                                                                    0
                                                                        S
 1n
                                   If the null hypothesis is true, T 0 has a t distribution with n 
 1 degrees of freedom. When we
                                   know the distribution of the test statistic when H 0 is true (this is often called the reference
                                   distribution or the null distribution), we can locate the critical region to control the type I
                                   error probability at the desired level. In this case we would use the t percentage points 
t 	 2,n
1
                                   and t 	
 2,n
1  as the boundaries of the critical region so that we would reject H 0 :       0 if
                                                         t   t 	
 2,n
1    or if  t  
t 	
 2,n
1
                                                          0
                                                                             0
                                   where t 0 is the observed value of the test statistic T 0 . The test procedure is very similar to the
                                   test on the mean with known variance described in Section 9-2, except that T 0 is used as the
                                   test statistic instead of Z 0 and the t n
1 distribution is used to define the critical region instead
                                   of the standard normal distribution. A summary of the test procedures for both two- and one-
                                   sided alternative hypotheses follows:
                           The One-
                        Sample t-Test  Null hypothesis:  H 0 :     0

                                                           X 
   0
                                       Test statistic:  T
                                                        0
                                                            S
 1n
                                        Alternative hypothesis     Rejection criteria
                                            H 1 :   Z   0    t 0   t 	/2,n
1   or  t 0  
t 	/2,n
1
                                            H 1 :     0      t 0   t 	,n
1
                                            H 1 :     0      t 0  
t 	,n
1

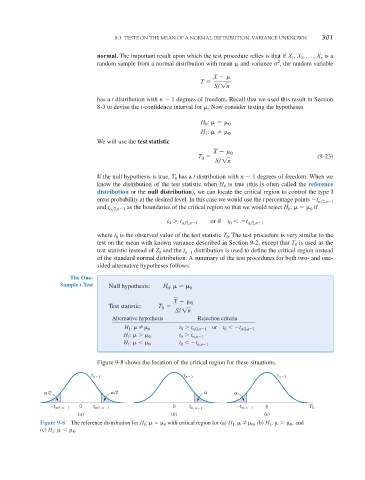
                                   Figure 9-8 shows the location of the critical region for these situations.

                                 t n – 1                       t n – 1                      t n – 1

                   α
                                          /2
                     /2                α                             α        α
                     –t α     0   t α                      0    t α            –t α     0             T 0
                                                                                    , n – 1
                                     /2, n – 1
                                                                    , n – 1
                         /2, n – 1
                             (a)                           (b)                          (c)
                 Figure 9-8  The reference distribution for H 0 :       0 with critical region for (a) H 1 :   Z   0 ,  (b) H 1 :     0 ,  and
                 (c) H 1 :     0 .
   348   349   350   351   352   353   354   355   356   357   358