
Page 130 - Applied statistics and probability for engineers
P. 130
108 Chapter 4/Continuous Random Variables and Probability Distributions
Learning Objectives
After careful study of this chapter, you should be able to do the following:
1. Determine probabilities from probability density functions
2. Determine probabilities from cumulative distribution functions and cumulative distribution functions
from probability density functions, and the reverse
3. Calculate means and variances for continuous random variables
4. Understand the assumptions for some common continuous probability distributions
5. Select an appropriate continuous probability distribution to calculate probabilities in specific applications
6. Calculate probabilities, determine means and variances for some common continuous probability
distributions
7. Standardize normal random variables
8. Use the table for the cumulative distribution function of a standard normal distribution to calculate
probabilities
9. Approximate probabilities for some binomial and Poisson distributions
4-1 Continuous Random Variables
Suppose that a dimensional length is measured on a manufactured part selected from a day’s
production. In practice, there can be small variations in the measurements due to many causes,
such as vibrations, temperature luctuations, operator differences, calibrations, cutting tool
wear, bearing wear, and raw material changes. In an experiment such as this, the measurement
is naturally represented as a random variable X, and it is reasonable to model the range of
possible values of X with an interval of real numbers. Recall from Chapter 2 that a continu-
ous random variable is a random variable with an interval (either inite or ininite) of real
numbers for its range. The model provides for any precision in length measurements.
Because the number of possible values of X is uncountably ininite, X has a distinctly
different distribution from the discrete random variables studied previously. But as in the dis-
crete case, many physical systems can be modeled by the same or similar continuous random
variables. These random variables are described, and example computations of probabilities,
means, and variances are provided in the sections of this chapter.
4-2 Probability Distributions and Probability
Density Functions
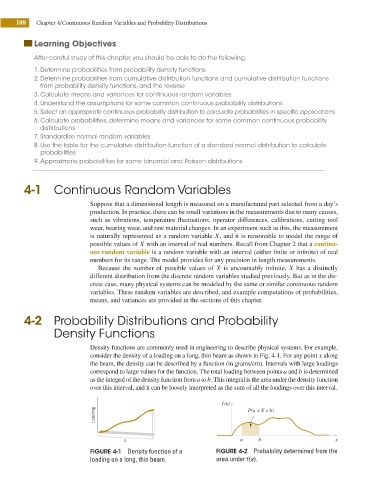
Density functions are commonly used in engineering to describe physical systems. For example,
consider the density of a loading on a long, thin beam as shown in Fig. 4-1. For any point x along
the beam, the density can be described by a function (in grams/cm). Intervals with large loadings
correspond to large values for the function. The total loading between points a and b is determined
as the integral of the density function from a to b. This integral is the area under the density function
over this interval, and it can be loosely interpreted as the sum of all the loadings over this interval.
f (x)
Loading P(a < X < b)
x a b x
FIGURE 4-1 Density function of a FIGURE 4-2 Probability determined from the
loading on a long, thin beam. area under f x( ).