Page 96 - Applied statistics and probability for engineers
P. 96

74   Chapter 3/Discrete Random Variables and Probability Distributions


               3-4      Mean and Variance of a Discrete Random Variable

                                   Two numbers are often used to summarize a probability distribution for a random variable X. The
                                   mean is a measure of the center or middle of the probability distribution, and the variance is a
                                   measure of the dispersion, or variability in the distribution. These two measures do not uniquely
                                   identify a probability distribution. That is, two different distributions can have the same mean and
                                   variance. Still, these measures are simple, useful summaries of the probability distribution of X.

                Mean, Variance, and                                                                   (
                 Standard Deviation  The mean or expected value of the discrete random variable X, denoted as μ or E X , )  is
                                                                           ( )
                                                                E X
                                                             μ = ( ) = ∑ xf x                          (3-3)
                                                                       x
                                                                   (
                                                               2
                                     The variance of X, denoted as σ  or V X , )  is
                                                           (
                                                                                 )
                                                                            (
                                                                                             (
                                                                  (
                                                                                    (
                                                       2
                                                                                           2
                                                                                  2
                                                      σ =V X)  = E X −μ) 2  = ∑ x −μ f x) = ∑ x f x) − μ 2
                                                                           x             x
                                                                     2
                                     The standard deviation of X  is σ = σ .
                                     The mean of a discrete random variable X is a weighted average of the possible values of X
                                   with weights equal to the probabilities. If  f x ( ) is the probability mass function of a loading on a
                                   long, thin beam, E X ( ) is the point at which the beam balances. Consequently, E X ( ) describes the
                                   “center” of the distribution of X in a manner similar to the balance point of a loading. See Fig. 3-5.
                                     The variance of a random variable X is a measure of dispersion or scatter in the pos-
                                   sible values for X. The variance of X uses weight  f x ( ) as the multiplier of each possi-
                                                     (
                                                           2
                                   ble squared deviation  x − μ) . Figure 3-5 illustrates probability distributions with equal
                                   means but different variances. Properties of summations and the deinition of μ can be
                                   used to show the equality of the formulas for variance.
                                                V X ( ) = ( x − μ) (    x f x ( ) − μ∑ xf x ( ) + μ ∑  f x ( )
                                                                f x) = ∑
                                                       ∑
                                                              2
                                                                                           2
                                                                         2
                                                                               2
                                                       x              x           x         x
                                                     = ∑  x f x ( ) − μ + μ = ∑ x f  ( ) − μx  2
                                                                    +
                                                                       2
                                                                             2
                                                                   2
                                                          2
                                                                 2
                                                       x                   x
                                   Either formula for V x ( ) can be used. Figure 3-6 illustrates that two probability distributions
                                   can differ even though they have identical means and variances.
                                   0    2    4     6    8    10      0    2     4    6    8    10
                                                (a)                               (b)
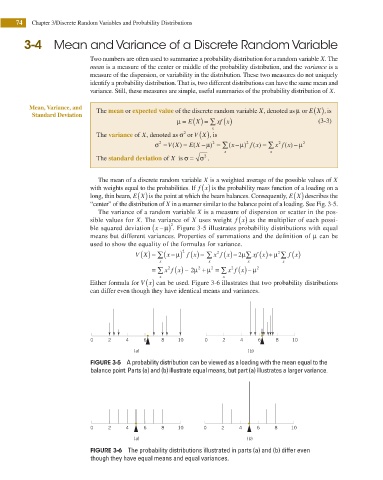
                                   FIGURE 3-5  A probability distribution can be viewed as a loading with the mean equal to the
                                   balance point. Parts (a) and (b) illustrate equal means, but part (a) illustrates a larger variance.


                                   0    2    4     6    8    10      0    2    4     6    8    10
                                                (a)                               (b)
                                   FIGURE 3-6  The probability distributions illustrated in parts (a) and (b) differ even
                                   though they have equal means and equal variances.
   91   92   93   94   95   96   97   98   99   100   101