
Page 94 - Applied statistics and probability for engineers
P. 94
72 Chapter 3/Discrete Random Variables and Probability Distributions
Furthermore, P X ( = x i) can be determined from the jump at the value x i . More
specii cally,
−
P X = x i ) = F x i ) lim ( )
(
(
F x i
↑
x x i
and this expression calculates the difference between F x i ( ) and the limit as x increases
to x i .
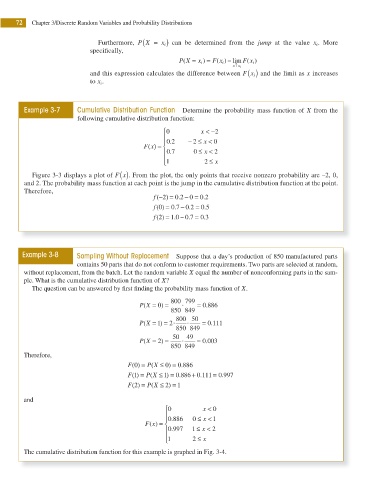
Example 3-7 Cumulative Distribution Function Determine the probability mass function of X from the
following cumulative distribution function:
⎧0 x < −2
⎪ . 0 2 − ≤ x < 0
⎪
2
(
F x) = ⎨
⎪ . 0 7 0 ≤ x < 2
⎩
⎪ 1 2 ≤ x
Figure 3-3 displays a plot of F x ( ). From the plot, the only points that receive nonzero probability are –2, 0,
and 2. The probability mass function at each point is the jump in the cumulative distribution function at the point.
Therefore,
.
f (−2 ) = 0 2 − = 0 2
0
.
−
.
.
.
f (0) = 0 7 0 2 = 0 5
−
f (2) = 1 0 0 7 = 0 3
.
.
.
Example 3-8 Sampling Without Replacement Suppose that a day’s production of 850 manufactured parts
contains 50 parts that do not conform to customer requirements. Two parts are selected at random,
without replacement, from the batch. Let the random variable X equal the number of nonconforming parts in the sam-
ple. What is the cumulative distribution function of X?
The question can be answered by i rst inding the probability mass function of X.
⋅
(
P X = 0 ) = 800 799 = 0 886
.
850 849
⋅
(
P X = 1 ) = 2 ⋅ 800 50 = 0 111
.
850 849
(
P X = 2) = 50 ⋅ 49 = 0 003
)
.
850 849
Therefore,
F( ) = P X ≤ ) 0 = 0 886
(
.
0
F( ) = P X ≤ ) 1 = 0 886 0 111 0 997
+
(
=
.
.
.
1
(
F( ) = P X ≤ ) 2 = 1
2
1
and
⎧0 x < 0
⎪ ≤
⎪
F x) = ⎨ . 0 886 0 x < 1
(
⎪ . 0 997 1 ≤ x < 2
⎩ 2 ≤ x
⎪ 1
The cumulative distribution function for this example is graphed in Fig. 3-4.