
Page 43 - Applied Statistics Using SPSS, STATISTICA, MATLAB and R
P. 43
22 1 Introduction
Graphs : Operations with graphs.
Tools : Selection conditions, macros, user options, etc.
Data : Several operations with the data, namely sorting, recalculation
and recoding of data.
Besides the menu options there are alternative ways to perform a given
operation using icons and key combinations (using underlined characters).
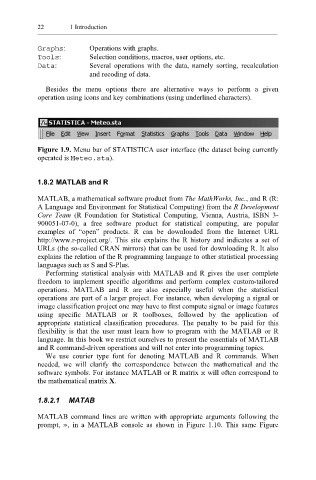
Figure 1.9. Menu bar of STATISTICA user interface (the dataset being currently
operated is Me teo.sta ).
1.8.2 MATLAB and R
MATLAB, a mathematical software product from The MathWorks, Inc., and R (R:
A Language and Environment for Statistical Computing) from the R Development
Core Team (R Foundation for Statistical Computing, Vienna, Austria, ISBN 3-
900051-07-0), a free software product for statistical computing, are popular
examples of “open” products. R can be downloaded from the Internet URL
http://www.r-project.org/. This site explains the R history and indicates a set of
URLs (the so-called CRAN mirrors) that can be used for downloading R. It also
explains the relation of the R programming language to other statistical processing
languages such as S and S-Plus.
Performing statistical analysis with MATLAB and R gives the user complete
freedom to implement specific algorithms and perform complex custom-tailored
operations. MATLAB and R are also especially useful when the statistical
operations are part of a larger project. For instance, when developing a signal or
image classification project one may have to first compute signal or image features
using specific MATLAB or R toolboxes, followed by the application of
appropriate statistical classification procedures. The penalty to be paid for this
flexibility is that the user must learn how to program with the MATLAB or R
language. In this book we restrict ourselves to present the essentials of MATLAB
and R command-driven operations and will not enter into programming topics.
We use courier type font for denoting MATLAB and R commands. When
needed, we will clarify the correspondence between the mathematical and the
software symbols. For instance MATLAB or R matrix x will often correspond to
the mathematical matrix X.
1.8.2.1 MATAB
MATLAB command lines are written with appropriate arguments following the
prompt, » , in a MATLAB console as shown in Figure 1.10. This same Figure