
Page 46 - Applied Statistics Using SPSS, STATISTICA, MATLAB and R
P. 46
1.8 Software Tools 25
On-line help about general or specific topics of MATLAB can be obtained from
the Help menu option. On-line help about a specific function can be obtained by
just typing it after the help command, as seen above.
1.8.2.2 R
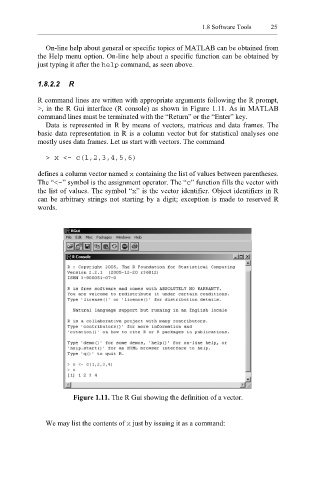
R command lines are written with appropriate arguments following the R prompt,
>, in the R Gui interface (R console) as shown in Figure 1.11. As in MATLAB
command lines must be terminated with the “Return” or the “Enter” key.
Data is represented in R by means of vectors, matrices and data frames. The
basic data representation in R is a column vector but for statistical analyses one
mostly uses data frames. Let us start with vectors. The command
> x <- c(1,2,3,4,5,6)
defines a column vector named containing the list of values between parentheses.
x
The “<-” symbol is the assignment operator. The “c” function fills the vector with
the list of values. The symbol “x” is the vector identifier. Object identifiers in R
can be arbitrary strings not starting by a digit; exception is made to reserved R
words.
Figure 1.11. The R Gui showing the definition of a vector.
We may list the contents of x just by issuing it as a command: