
Page 50 - Applied Statistics Using SPSS, STATISTICA, MATLAB and R
P. 50
2 Presenting and Summarising the Data
Presenting and summarising the data is certainly the introductory task in any
statistical analysis project and comprehends a set of topics and techniques,
collectively known as descriptive statistics.
2.1 Preliminaries
2.1.1 Reading in the Data
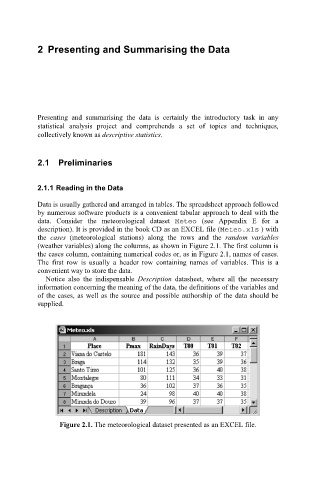
Data is usually gathered and arranged in tables. The spreadsheet approach followed
by numerous software products is a convenient tabular approach to deal with the
data. Consider the meteorological dataset Meteo (see Appendix E for a
description). It is provided in the book CD as an EXCEL file ( Meteo. xls ) with
the cases (meteorological stations) along the rows and the random variables
(weather variables) along the columns, as shown in Figure 2.1. The first column is
the cases column, containing numerical codes or, as in Figure 2.1, names of cases.
The first row is usually a header row containing names of variables. This is a
convenient way to store the data.
Notice also the indispensable Description datasheet, where all the necessary
information concerning the meaning of the data, the definitions of the variables and
of the cases, as well as the source and possible authorship of the data should be
supplied.
Figure 2.1. The meteorological dataset presented as an EXCEL file.