
Page 49 - Applied Statistics Using SPSS, STATISTICA, MATLAB and R
P. 49
28 1 Introduction
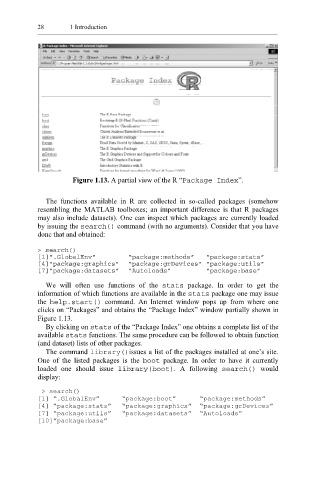
Figure 1.13. A partial view of the R “Package Index”.
The functions available in R are collected in so-called packages (somehow
resembling the MATLAB toolboxes; an important difference is that R packages
may also include datasets). One can inspect which packages are currently loaded
by issuing the search() command (with no arguments). Consider that you have
done that and obtained:
> search()
[1]”.GlobalEnv” “package:methods” “package:stats”
[4]”package:graphics” “package:grDevices” “package:utils”
[7]”package:datasets” “Autoloads” “package:base”
We will often use functions of the stats package. In order to get the
information of which functions are available in the stats package one may issue
the help.start() command. An Internet window pops up from where one
clicks on “Packages” and obtains the “Package Index” window partially shown in
Figure 1.13.
By clicking on stats of the “Package Index” one obtains a complete list of the
available ts sta functions. The same procedure can be followed to obtain function
(and dataset) lists of other packages.
The command library()issues a list of the packages installed at one’s site.
One of the listed packages is the boot package. In order to have it currently
loaded one should issue l ibrary(boot) . A following search( ) would
display:
> search()
[1] “.GlobalEnv” “package:boot” “package:methods”
[4] “package:stats” “package:graphics” “package:grDevices”
[7] “package:utils” “package:datasets” “Autoloads”
[10]”package:base”