
Page 53 - Applied Statistics Using SPSS, STATISTICA, MATLAB and R
P. 53
32 2 Presenting and Summarising the Data
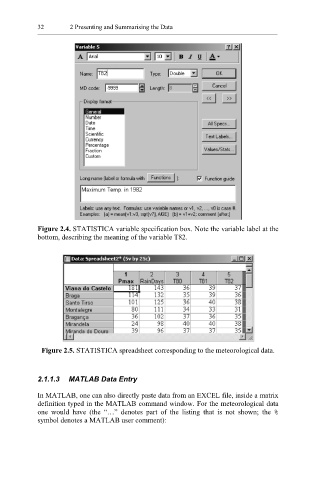
Figure 2.4. STATISTICA variable specification box. Note the variable label at the
bottom, describing the meaning of the variable T82.
Figure 2.5. STATISTICA spreadsheet corresponding to the meteorological data.
2.1.1.3 MATLAB Data Entry
In MATLAB, one can also directly paste data from an EXCEL file, inside a matrix
definition typed in the MATLAB command window. For the meteorological data
one would have (the “…” denotes part of the listing that is not shown; the %
symbol denotes a MATLAB user comment):