
Page 51 - Applied Statistics Using SPSS, STATISTICA, MATLAB and R
P. 51
30 2 Presenting and Summarising the Data
Carrying out this dataset into SPSS, STATISTICA or MATLAB is an easy task.
The basic thing to do is to select the data in the usual way (mouse dragging
between two corners of the data speadsheet), copy the data (e.g., using the
CTRL+C keys) and paste it (e.g., using the CTRL+V keys). In R data has to be
read from a text file. One can also, of course, type in the data directly into the
SPSS or STATISTICA spreadsheets or into the MATLAB command window or
the R console. This is usually restricted to small datasets. In the following
subsections we present the basics of data entry in SPSS, STATISTICA, MATLAB
and R.
2.1.1.1 SPSS Data Entry
When first starting SPSS a file specification box may be displayed and the user
asked whether a (last operated) data file should be opened. One can cancel this file
specification box and proceed to define a new data file ( File , New ), where the
data can be pasted (from EXCEL) or typed in. The SPSS data spreadsheet starts
with a comfortably large number of variables and cases. Further variables and
cases may be added when needed (use the Insert Variable or Insert
Case options of the Data menu). One can then proceed to add specifications to
the variables, either by double clicking with the mouse left button over the column
heading or by clicking on the Variable View tab underneath (this is a toggle
tab, toggling between the Variable View and the Data View ). The
Variable View and Data View spreadsheets for the meteorological data
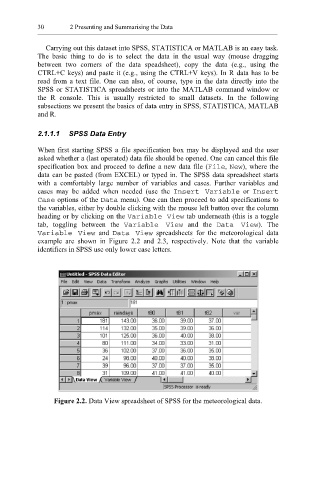
example are shown in Figure 2.2 and 2.3, respectively. Note that the variable
identifiers in SPSS use only lower case letters.
Figure 2.2. Data View spreadsheet of SPSS for the meteorological data.