
Page 42 - Applied Statistics Using SPSS, STATISTICA, MATLAB and R
P. 42
1.8 Software Tools 21
In the following we use courier type font for denoting SPSS and STATISTICA
commands.
1.8.1.1 SPSS
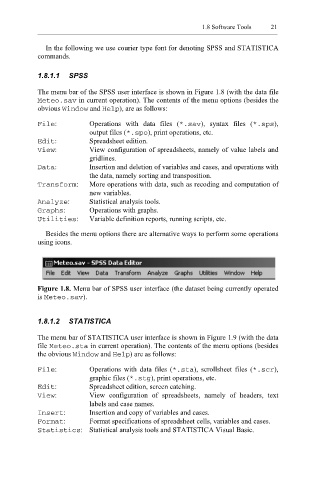
The menu bar of the SPSS user interface is shown in Figure 1.8 (with the data file
Meteo.sav in current operation). The contents of the menu options (besides the
obvious ow Wind and Help ), are as follows:
File : Operations with data files ( *.sav ), syntax files ( sps *. ),
output files (* .spo ), print operations, etc.
Edit : Spreadsheet edition.
View : View configuration of spreadsheets, namely of value labels and
gridlines.
Data : Insertion and deletion of variables and cases, and operations with
the data, namely sorting and transposition.
Transform : More operations with data, such as recoding and computation of
new variables.
Analyze : Statistical analysis tools.
Graphs : Operations with graphs.
Utilities : Variable definition reports, running scripts, etc.
Besides the menu options there are alternative ways to perform some operations
using icons.
Figure 1.8. Menu bar of SPSS user interface (the dataset being currently operated
is Meteo.sav ).
1.8.1.2 STATISTICA
The menu bar of STATISTICA user interface is shown in Figure 1.9 (with the data
file Meteo.sta in current operation). The contents of the menu options (besides
the obvious ndow Wi and lp He ) are as follows:
File : Operations with data files ( .sta * ), scrollsheet files ( *.scr ),
graphic files ( *.stg ), print operations, etc.
Edit : Spreadsheet edition, screen catching.
View : View configuration of spreadsheets, namely of headers, text
labels and case names.
Insert : Insertion and copy of variables and cases.
Format : Format specifications of spreadsheet cells, variables and cases.
Statistics : Statistical analysis tools and STATISTICA Visual Basic.