
Page 98 - Applied Statistics Using SPSS, STATISTICA, MATLAB and R
P. 98
Exercises 77
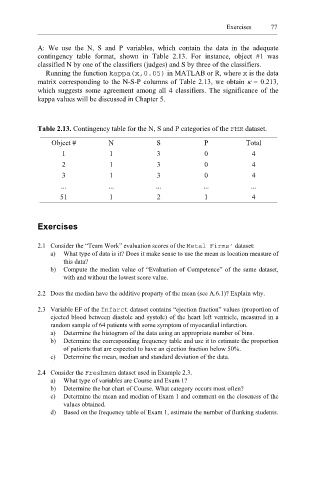
A: We use the N, S and P variables, which contain the data in the adequate
contingency table format, shown in Table 2.13. For instance, object #1 was
classified N by one of the classifiers (judges) and S by three of the classifiers.
Running the function kappa(x,0.05) in MATLAB or R, where x is the data
matrix corresponding to the N-S-P columns of Table 2.13, we obtain κ = 0.213,
which suggests some agreement among all 4 classifiers. The significance of the
kappa values will be discussed in Chapter 5.
Table 2.13. Contingency table for the N, S and P categories of the FHR dataset.
Object # N S P Total
1 1 3 0 4
2 1 3 0 4
3 1 3 0 4
... ... ... ... ...
51 1 2 1 4
Exercises
2.1 Consider the “Team Work” evaluation scores of the Metal Firms’ dataset:
a) What type of data is it? Does it make sense to use the mean as location measure of
this data?
b) Compute the median value of “Evaluation of Competence” of the same dataset,
with and without the lowest score value.
2.2 Does the median have the additive property of the mean (see A.6.1)? Explain why.
2.3 Variable EF of the Infarct dataset contains “ejection fraction” values (proportion of
ejected blood between diastole and systole) of the heart left ventricle, measured in a
random sample of 64 patients with some symptom of myocardial infarction.
a) Determine the histogram of the data using an appropriate number of bins.
b) Determine the corresponding frequency table and use it to estimate the proportion
of patients that are expected to have an ejection fraction below 50%.
c) Determine the mean, median and standard deviation of the data.
2.4 Consider the eshmen Fr dataset used in Example 2.3.
a) What type of variables are Course and Exam 1?
b) Determine the bar chart of Course. What category occurs most often?
c) Determine the mean and median of Exam 1 and comment on the closeness of the
values obtained.
d) Based on the frequency table of Exam 1, estimate the number of flunking students.