
Page 214 - Artificial Intelligence for Computational Modeling of the Heart
P. 214
Chapter 6 Additional clinical applications 187
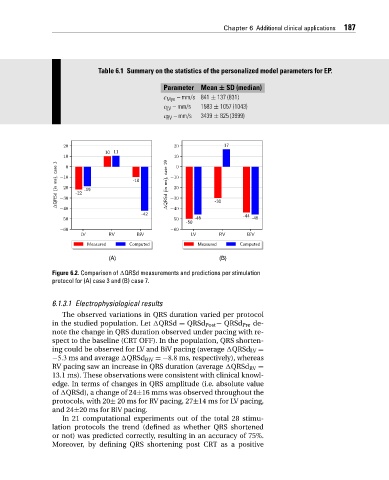
Table 6.1 Summary on the statistics of the personalized model parameters for EP.
Parameter Mean ± SD (median)
c Myo – mm/s 841 ± 137 (831)
c – mm/s 1583 ± 1057 (1043)
LV
c RV – mm/s 3439 ± 825 (3999)
Figure 6.2. Comparison of QRSd measurements and predictions per stimulation
protocol for (A) case 3 and (B) case 7.
6.1.3.1 Electrophysiological results
The observed variations in QRS duration varied per protocol
in the studied population. Let QRSd = QRSd Post − QRSd Pre de-
note the change in QRS duration observed under pacing with re-
spect to the baseline (CRT OFF). In the population, QRS shorten-
ing could be observed for LV and BiV pacing (average QRSd LV =
−5.3 ms and average QRSd BiV =−8.8 ms, respectively), whereas
RV pacing saw an increase in QRS duration (average QRSd RV =
13.1 ms). These observations were consistent with clinical knowl-
edge. In terms of changes in QRS amplitude (i.e. absolute value
of QRSd), a change of 24±16 mms was observed throughout the
protocols, with 20± 20 ms for RV pacing, 27±14 ms for LV pacing,
and 24±20 ms for BiV pacing.
In 21 computational experiments out of the total 28 stimu-
lation protocols the trend (defined as whether QRS shortened
or not) was predicted correctly, resulting in an accuracy of 75%.
Moreover, by defining QRS shortening post CRT as a positive