
Page 216 - Artificial Intelligence for Computational Modeling of the Heart
P. 216
Chapter 6 Additional clinical applications 189
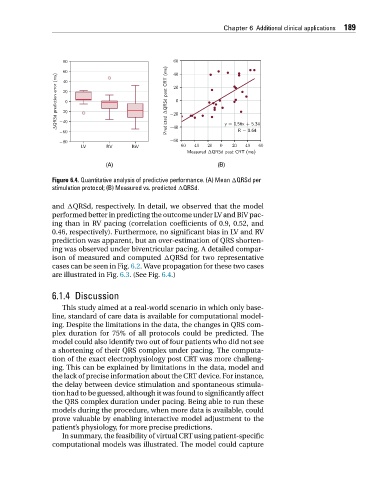
Figure 6.4. Quantitative analysis of predictive performance. (A) Mean QRSd per
stimulation protocol; (B) Measured vs. predicted QRSd.
and QRSd, respectively. In detail, we observed that the model
performed better in predicting the outcome under LV and BiV pac-
ing than in RV pacing (correlation coefficients of 0.9, 0.52, and
0.46, respectively). Furthermore, no significant bias in LV and RV
prediction was apparent, but an over-estimation of QRS shorten-
ing was observed under biventricular pacing. A detailed compar-
ison of measured and computed QRSd for two representative
cases can be seen in Fig. 6.2. Wave propagation for these two cases
are illustrated in Fig. 6.3.(SeeFig. 6.4.)
6.1.4 Discussion
This study aimed at a real-world scenario in which only base-
line, standard of care data is available for computational model-
ing. Despite the limitations in the data, the changes in QRS com-
plex duration for 75% of all protocols could be predicted. The
model could also identify two out of four patients who did not see
a shortening of their QRS complex under pacing. The computa-
tion of the exact electrophysiology post CRT was more challeng-
ing. This can be explained by limitations in the data, model and
the lack of precise information about the CRT device. For instance,
the delay between device stimulation and spontaneous stimula-
tion had to be guessed, although it was found to significantly affect
the QRS complex duration under pacing. Being able to run these
models during the procedure, when more data is available, could
prove valuable by enabling interactive model adjustment to the
patient’s physiology, for more precise predictions.
In summary, the feasibility of virtual CRT using patient-specific
computational models was illustrated. The model could capture