
Page 215 - Artificial Intelligence for Computational Modeling of the Heart
P. 215
188 Chapter 6 Additional clinical applications
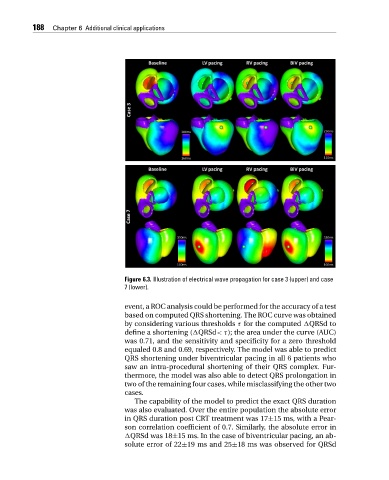
Figure 6.3. Illustration of electrical wave propagation for case 3 (upper) and case
7(lower).
event, a ROC analysis could be performed for the accuracy of a test
based on computed QRS shortening. The ROC curve was obtained
by considering various thresholds τ for the computed QRSd to
define a shortening ( QRSd<τ); the area under the curve (AUC)
was 0.71, and the sensitivity and specificity for a zero threshold
equaled 0.8 and 0.69, respectively. The model was able to predict
QRS shortening under biventricular pacing in all 6 patients who
saw an intra-procedural shortening of their QRS complex. Fur-
thermore, the model was also able to detect QRS prolongation in
two of the remaining four cases, while misclassifying the other two
cases.
The capability of the model to predict the exact QRS duration
was also evaluated. Over the entire population the absolute error
in QRS duration post CRT treatment was 17±15 ms, with a Pear-
son correlation coefficient of 0.7. Similarly, the absolute error in
QRSd was 18±15 ms. In the case of biventricular pacing, an ab-
solute error of 22±19 ms and 25±18 ms was observed for QRSd