
Page 99 - Artificial Intelligence for Computational Modeling of the Heart
P. 99
Chapter 2 Implementation of a patient-specific cardiac model 69
equal to the relaxation rate −k RS , which relates to the rate of un-
binding of the cross-bridge, and hence the decrease in contraction
force.
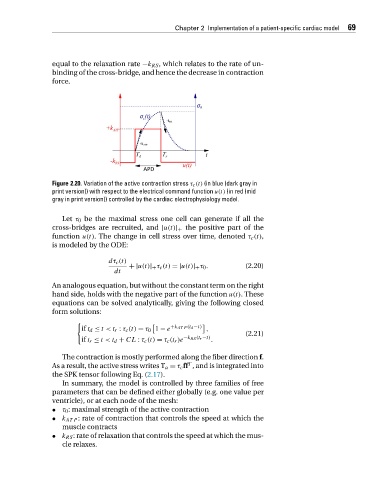
Figure 2.20. Variation of the active contraction stress τ c (t) (in blue (dark gray in
print version)) with respect to the electrical command function u(t) (in red (mid
gray in print version)) controlled by the cardiac electrophysiology model.
Let τ 0 be the maximal stress one cell can generate if all the
cross-bridges are recruited, and |u(t)| + the positive part of the
function u(t). The change in cell stress over time, denoted τ c (t),
is modeled by the ODE:
dτ c (t)
+|u(t)| + τ c (t) =|u(t)| + τ 0 . (2.20)
dt
An analogous equation, but without the constant term on the right
hand side, holds with the negative part of the function u(t).These
equations can be solved analytically, giving the following closed
form solutions:
+k AT P (t d −t)
if t d ≤ t< t r : τ c (t) = τ 0 1 − e ,
(2.21)
if t r ≤ t< t d + CL : τ c (t) = τ c (t r )e −k RS (t r −t) .
The contraction is mostly performed along the fiber direction f.
T
As a result, the active stress writes T a = τ c ff , and is integrated into
the SPK tensor following Eq. (2.17).
In summary, the model is controlled by three families of free
parameters that can be defined either globally (e.g. one value per
ventricle), or at each node of the mesh:
• τ 0 : maximal strength of the active contraction
• k AT P : rate of contraction that controls the speed at which the
muscle contracts
• k RS : rate of relaxation that controls the speed at which the mus-
cle relaxes.