
Page 306 - Automotive Engineering Powertrain Chassis System and Vehicle Body
P. 306
Tyres and wheels C HAPTER 10.1
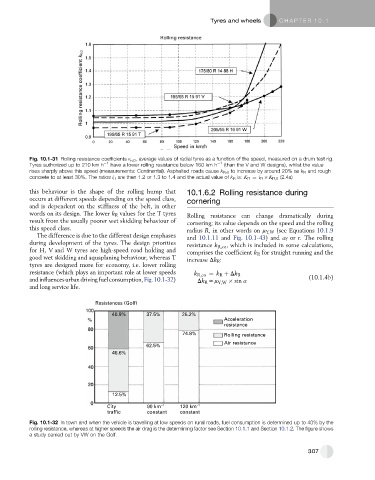
Fig. 10.1-31 Rolling resistance coefficients K R,0 , average values of radial tyres as a function of the speed, measured on a drum test rig.
Tyres authorized up to 210 km h 1 have a lower rolling resistance below 160 km h 1 (than the V and W designs), whilst the value
rises sharply above this speed (measurements: Continental). Asphalted roads cause k R , 0 to increase by around 20% as k R and rough
concrete to at least 30%. The ratios i R are then 1.2 or 1.3 to 1.4 and the actual value of k R is: K R ¼ i R K R;0 (2.4a)
this behaviour is the shape of the rolling hump that 10.1.6.2 Rolling resistance during
occurs at different speeds depending on the speed class, cornering
and is dependent on the stiffness of the belt, in other
words on its design. The lower k R values for the T tyres Rolling resistance can change dramatically during
result from the usually poorer wet skidding behaviour of cornering; its value depends on the speed and the rolling
this speed class. radius R, in other words on m Y,W (see Equations 10.1.9
The difference is due to the different design emphases and 10.1.11 and Fig. 10.1-43) and a f or r. The rolling
during development of the tyres. The design priorities resistance k R,co , which is included in some calculations,
for H, V and W tyres are high-speed road holding and comprises the coefficient k R for straight running and the
good wet skidding and aquaplaning behaviour, whereas T increase Dk R :
tyres are designed more for economy, i.e. lower rolling
resistance (which plays an important role at lower speeds k R;co ¼ k R þ Dk R
andinfluencesurbandrivingfuelconsumption,Fig.10.1-32) Dk R zm Y;W sin a (10.1.4b)
and long service life.
Resistances (Golf)
40.9% 37.5% 25.2%
Acceleration
resistance
74.8% Rolling resistance
Air resistance
62.5%
46.6%
12.5%
City 90 km –1 120 km –1
traffic constant constant
Fig. 10.1-32 In town and when the vehicle is travelling at low speeds on rural roads, fuel consumption is determined up to 40% by the
rolling resistance, whereas at higher speeds the air drag is the determining factor see Section 10.1.1 and Section 10.1.2. The figure shows
a study carried out by VW on the Golf.
307