Page 681 - Automotive Engineering Powertrain Chassis System and Vehicle Body
P. 681
CHAP TER 2 1. 1       Interior noise: Assessment and control

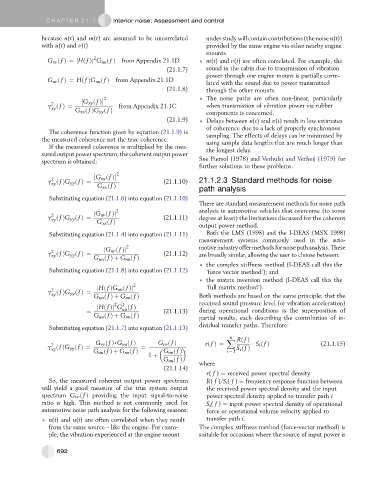
               because n(t) and m(t) are assumed to be uncorrelated  under study will contain contributions (the noise n(t))
               with u(t) and v(t)                                   provided by the same engine via other nearby engine
                                                                    mounts.
                                2
                 G vv ðf Þ¼ jHðf Þj G uu ðf Þ  from Appendix 21:1D    m(t) and v(t) are often correlated. For example, the
                                                       (21.1.7)     sound in the cabin due to transmission of vibration
                                                                    power through one engine mount is partially corre-
                 G uv ðf Þ¼ Hðf ÞG uu ðf Þ from Appendix 21:1D
                                                                    lated with the sound due to power transmitted
                                                       (21.1.8)     through the other mounts.

                              G xy ðf Þ   2                         The noise paths are often non-linear, particularly
                  2
                 g ðf Þ¼                from Appendix 21:1C         when transmission of vibration power via rubber
                  xy
                          G xx ðf ÞG yy ðf Þ
                                                                    components is concerned.
                                                       (21.1.9)     Delays between u(t)and v(t) result in low estimates
                                                                    of coherence due to a lack of properly synchronous
                 The coherence function given by equation (21.1.9) is  sampling. The effects of delays can be minimised by
               the measured coherence not the true coherence.       using sample data lengths that are much longer than
                 If the measured coherence is multiplied by the mea-  the longest delay.
               sured output power spectrum, the coherent output power
               spectrum is obtained:                              See Piersol (1978) and Verhulst and Verheij (1979) for
                                                                  further solutions to these problems.

                                  G xy ðf Þ   2
                  2
                 g ðf ÞG yy ðf Þ¼                     (21.1.10)   21.1.2.3 Standard methods for noise
                  xy
                                 G xx ðf Þ
                                                                  path analysis
                 Substituting equation (21.1.6) into equation (21.1.10)
                                                                  There are standard measurement methods for noise path
                                jG uv ðf Þj 2                     analysis in automotive vehicles that overcome (to some
                  2
                 g ðf ÞG yy ðf Þ¼                     (21.1.11)   degree at least) the limitations discussed for the coherent
                  xy
                                 G xx ðf Þ
                                                                  output power method.
                 Substituting equation (21.1.4) into equation (21.1.11)  Both the LMS (1998) and the I-DEAS (MSX 1998)
                                                                  measurement systems commonly used in the auto-
                  2
                 g ðf ÞG yy ðf Þ¼  jG uv ðf Þj 2      (21.1.12)   motiveindustryoffermethodsfornoisepathanalysis.These
                                                                  are broadly similar, allowing the user to choose between:
                  xy
                                G uu ðf Þþ G nn ðf Þ
                                                                    the complex stiffness method (I-DEAS call this the
                 Substituting equation (21.1.8) into equation (21.1.12)  ‘force vector method’); and
                                                                    the matrix inversion method (I-DEAS call this the
                                             2
                                 jHðf ÞG uu ðf Þj                   ‘full matrix method’).
                  2
                 g ðf ÞG yy ðf Þ¼  G uu ðf Þþ G nn ðf Þ           Both methods are based on the same principle: that the
                  xy
                                      2
                                         2
                                 jHðf Þj G ðf Þ                   received sound pressure level (or vibration acceleration)
                                         uu
                             ¼                        (21.1.13)   during operational conditions is the superposition of
                                G uu ðf Þþ G nn ðf Þ              partial results, each describing the contribution of in-
                                                                  dividual transfer paths. Therefore:
                 Substituting equation (21.1.7) into equation (21.1.13)
                                                                           X  Rðf Þ
                                                                            n
                                G vv ðf Þ,G uu ðf Þ  G vv ðf Þ      rðf Þ¼         $ S i ðf Þ             (21.1.15)
                  2
                 g ðf ÞG yy ðf Þ ¼             ¼                              S i ðf Þ
                  xy
                               G uu ðf Þþ G nn ðf Þ   G nn ðf Þ            i ¼ 1
                                                 1 þ
                                                      G uu ðf Þ
                                                                  where
                                                      (21.1.14)
                                                                    r( f ) ¼ received power spectral density
                 So, the measured coherent output power spectrum    R( f )/S i ( f ) ¼ frequency response function between
               will yield a good measure of the true system output  the received power spectral density and the input
               spectrum G vv ðf Þ providing the input signal-to-noise  power spectral density applied to transfer path i
               ratio is high. This method is not commonly used for  S i ( f ) ¼ input power spectral density of operational
               automotive noise path analysis for the following reasons:  force or operational volume velocity applied to
                 n(t) and u(t) are often correlated when they result  transfer path i.
                 from the same source – like the engine. For exam-  The complex stiffness method (force-vector method) is
                 ple, the vibration experienced at the engine mount  suitable for occasions where the source of input power is
                    692

