
Page 117 - Automotive Engineering
P. 117
CH AP TER 5 .1 Transmissions and driveline
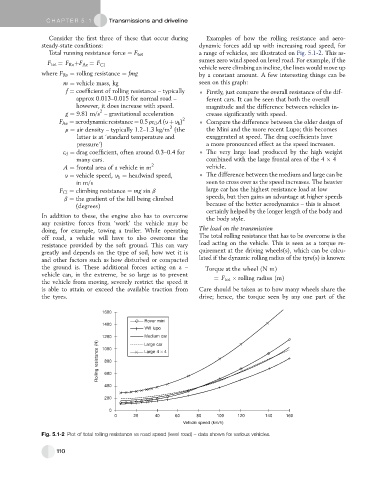
Consider the first three of these that occur during Examples of how the rolling resistance and aero-
steady-state conditions: dynamic forces add up with increasing road speed, for
Total running resistance force ¼ F tot a range of vehicles, are illustrated on Fig. 5.1-2. This as-
sumes zero wind speed on level road. For example, if the
F tot ¼ F Ro þF Ae ¼ F Cl
vehicle were climbing an incline, the lines would move up
where F Ro ¼ rolling resistance ¼ fmg by a constant amount. A few interesting things can be
m ¼ vehicle mass, kg seen on this graph:
f ¼ coefficient of rolling resistance – typically Firstly, just compare the overall resistance of the dif-
approx 0.013–0.015 for normal road – ferent cars. It can be seen that both the overall
however, it does increase with speed. magnitude and the difference between vehicles in-
2
g ¼ 9.81 m/s – gravitational acceleration crease significantly with speed.
F Ae ¼ aerodynamicresistance¼ 0.5rc d A(yþ y h ) 2 Compare the difference between the older design of
3
r ¼ air density – typically 1.2–1.3 kg/m (the the Mini and the more recent Lupo; this becomes
latter is at ‘standard temperature and exaggerated at speed. The drag coefficients have
pressure’) a more pronounced effect as the speed increases.
c d ¼ drag coefficient, often around 0.3–0.4 for The very large load produced by the high weight
many cars. combined with the large frontal area of the 4 4
A ¼ frontal area of a vehicle in m 2 vehicle.
y ¼ vehicle speed, y h ¼ headwind speed, The difference between the medium and large can be
in m/s seen to cross over as the speed increases. The heavier
F Cl ¼ climbing resistance ¼ mg sin b large car has the highest resistance load at low
b ¼ the gradient of the hill being climbed speeds, but then gains an advantage at higher speeds
(degrees) because of the better aerodynamics – this is almost
certainly helped by the longer length of the body and
In addition to these, the engine also has to overcome the body style.
any resistive forces from ‘work’ the vehicle may be
doing, for example, towing a trailer. While operating The load on the transmission
off road, a vehicle will have to also overcome the The total rolling resistance that has to be overcome is the
resistance provided by the soft ground. This can vary load acting on the vehicle. This is seen as a torque re-
greatly and depends on the type of soil, how wet it is quirement at the driving wheels(s), which can be calcu-
and other factors such as how disturbed or compacted lated if the dynamic rolling radius of the tyre(s) is known:
the ground is. These additional forces acting on a – Torque at the wheel ðNmÞ
vehicle can, in the extreme, be so large as to prevent ¼ F tot rolling radius ðmÞ
the vehicle from moving, severely restrict the speed it
is able to attain or exceed the available traction from Care should be taken as to how many wheels share the
the tyres. drive; hence, the torque seen by any one part of the
1600
Rover mini
1400
VW lupo
Medium car
1200 Large car
Rolling resistance (N) 1000 Large 4 × 4
800
600
400
200
0
0 20 40 60 80 100 120 140 160
Vehicle speed (km/h)
Fig. 5.1-2 Plot of total rolling resistance vs road speed (level road) – data shown for various vehicles.
110