
Page 120 - Automotive Engineering
P. 120
Transmissions and driveline CHAPTER 5.1
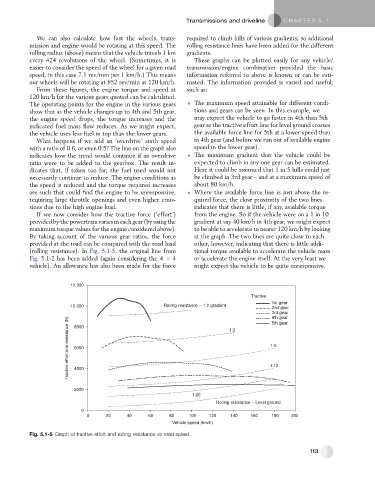
We can also calculate how fast the wheels, trans- required to climb hills of various gradients; so additional
mission and engine would be rotating at this speed. The rolling resistance lines have been added for the different
rolling radius (above) means that the vehicle travels 1 km gradients.
every 424 revolutions of the wheel. (Sometimes, it is These graphs can be plotted easily for any vehicle/
easier to consider the speed of the wheel for a given road transmission/engine combination provided the basic
speed, in this case 7.1 rev/min per 1 km/h.) This means information referred to above is known or can be esti-
our wheels will be rotating at 852 rev/min at 120 km/h. mated. The information provided is varied and useful;
From these figures, the engine torque and speed at such as:
120 km/h for the various gears quoted can be calculated.
The operating points for the engine in the various gears The maximum speed attainable for different condi-
show that as the vehicle changes up to 4th and 5th gear, tions and gears can be seen. In this example, we
the engine speed drops, the torque increases and the may expect the vehicle to go faster in 4th than 5th
indicated fuel mass flow reduces. As we might expect, gear as the tractive effort line for level ground crosses
the vehicle uses less fuel in top than the lower gears. the available force line for 5th at a lower speed than
What happens if we add an ‘overdrive’ sixth speed in 4th gear (and before we run out of available engine
with a ratio of 0.6, or even 0.5? The line on the graph also speed in the lower gear).
indicates how the trend would continue if an overdrive The maximum gradient that the vehicle could be
ratio were to be added to the gearbox. The result in- expected to climb in any one gear can be estimated.
dicates that, if taken too far, the fuel used would not Here it could be assumed that 1 in 5 hills could just
necessarily continue to reduce. The engine conditions as be climbed in 3rd gear – and at a maximum speed of
the speed is reduced and the torque required increases about 80 km/h.
are such that could find the engine to be unresponsive, Where the available force line is just above the re-
requiring large throttle openings and even higher emis- quired force, the close proximity of the two lines
sions due to the high engine load. indicates that there is little, if any, available torque
If we now consider how the tractive force (‘effort’) from the engine. So if the vehicle were on a 1 in 10
provided by the powertrain variesin each gear (by using the gradient at say 40 km/h in 4th gear, we might expect
maximum torque values for the engine considered above). to be able to accelerate to nearer 120 km/h by looking
By taking account of the various gear ratios, the force at the graph. The two lines are quite close to each
provided at the road can be compared with the road load other, however, indicating that there is little addi-
(rolling resistance). In Fig. 5.1-5, the original line from tional torque available to accelerate the vehicle mass
Fig. 5.1-2 has been added (again considering the 4 4 or accelerate the engine itself. At the very least we
vehicle). An allowance has also been made for the force might expect the vehicle to be quite unresponsive.
12 000
Tractive
1st gear
10 000 Rolling resistance – 1:2 gradient 2nd gear
3rd gear
Tractive effort and resistance (N) 6000 1:10
4th gear
5th gear
8000
1:3
1:5
4000
2000
1:20
Rolling resistance – Level ground
0
0 20 40 60 80 100 120 140 160 180 200
Vehicle speed (km/h)
Fig. 5.1-5 Graph of tractive effort and rolling resistance vs road speed.
113