
Page 44 - Automotive Engineering
P. 44
Measurement of torque, power, speed and fuel consumption CHAPTER 2.1
rises and at n ¼ n c it becomes theoretically infinite: the
shaft may fracture or non-linearities and internal
damping may prevent actual failure. With further in-
p ffiffiffiffiffiffiffi
creases in frequency the amplitude falls and at n 2n c it
is down to the level of the static deflection. Amplitude
continues to fall with increasing frequency.
The shaft connecting engine and dynamometer must
be designed with a suitable stiffness C s to ensure that
the critical frequency lies outside the normal operating
range of the engine, and also with a suitable degree of
damping to ensure that the unit may be run through the
Fig. 2.1a-2 Two mass system (compare with Fig. 2.1a-1). critical speed without the development of a dangerous
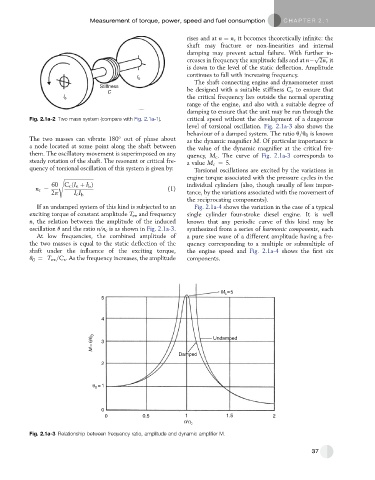
level of torsional oscillation. Fig. 2.1a-3 also shows the
behaviour of a damped system. The ratio q=q is known
0
The two masses can vibrate 180 out of phase about as the dynamic magnifier M. Of particular importance is
a node located at some point along the shaft between the value of the dynamic magnifier at the critical fre-
them. The oscillatory movement is superimposed on any quency, M c . The curve of Fig. 2.1a-3 corresponds to
steady rotation of the shaft. The resonant or critical fre- a value M c ¼ 5.
quency of torsional oscillation of this system is given by: Torsional oscillations are excited by the variations in
s ffiffiffiffiffiffiffiffiffiffiffiffiffiffiffiffiffiffiffiffiffiffiffi engine torque associated with the pressure cycles in the
60 C c ðI e þ I Þ individual cylinders (also, though usually of less impor-
b
n c ¼ (1)
2p I e I b tance, by the variations associated with the movement of
the reciprocating components).
If an undamped system of this kind is subjected to an Fig. 2.1a-4 shows the variation in the case of a typical
exciting torque of constant amplitude T ex and frequency single cylinder four-stroke diesel engine. It is well
n, the relation between the amplitude of the induced known that any periodic curve of this kind may be
oscillation q and the ratio n/n c is as shown in Fig. 2.1a-3. synthesized from a series of harmonic components, each
At low frequencies, the combined amplitude of a pure sine wave of a different amplitude having a fre-
the two masses is equal to the static deflection of the quency corresponding to a multiple or submultiple of
shaft under the influence of the exciting torque, the engine speed and Fig. 2.1a-4 shows the first six
q ¼ T ex =C s . As the frequency increases, the amplitude components.
0
Fig. 2.1a-3 Relationship between frequency ratio, amplitude and dynamic amplifier M.
37