
Page 192 - Autonomous Mobile Robots
P. 192
176 Autonomous Mobile Robots
Laser range data
Circle center
coordinates
Next scan point
Increment all cells
Determine weighting at distance R from Find accumulator
by multiplying corresponding cell cell with
by point range in accumulator grid most votes
by weighting
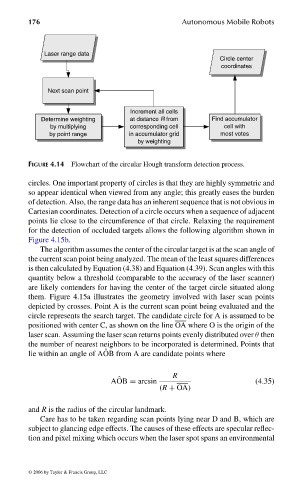
FIGURE 4.14 Flowchart of the circular Hough transform detection process.
circles. One important property of circles is that they are highly symmetric and
so appear identical when viewed from any angle; this greatly eases the burden
of detection. Also, the range data has an inherent sequence that is not obvious in
Cartesian coordinates. Detection of a circle occurs when a sequence of adjacent
points lie close to the circumference of that circle. Relaxing the requirement
for the detection of occluded targets allows the following algorithm shown in
Figure 4.15b.
The algorithm assumes the center of the circular target is at the scan angle of
the current scan point being analyzed. The mean of the least squares differences
is then calculated by Equation (4.38) and Equation (4.39). Scan angles with this
quantity below a threshold (comparable to the accuracy of the laser scanner)
are likely contenders for having the center of the target circle situated along
them. Figure 4.15a illustrates the geometry involved with laser scan points
depicted by crosses. Point A is the current scan point being evaluated and the
circle represents the search target. The candidate circle for A is assumed to be
positioned with center C, as shown on the line OA where O is the origin of the
laser scan. Assuming the laser scan returns points evenly distributed over θ then
the number of nearest neighbors to be incorporated is determined. Points that
ˆ
lie within an angle of AOB from A are candidate points where
R
AOB = arcsin (4.35)
ˆ
(R + OA)
and R is the radius of the circular landmark.
Care has to be taken regarding scan points lying near D and B, which are
subject to glancing edge effects. The causes of these effects are specular reflec-
tion and pixel mixing which occurs when the laser spot spans an environmental
© 2006 by Taylor & Francis Group, LLC
FRANKL: “dk6033_c004” — 2006/3/31 — 16:42 — page 176 — #28