
Page 71 - Autonomous Mobile Robots
P. 71
54 Autonomous Mobile Robots
the RADAR used in this work, an experimental determination of the power
noise distributions is used here.
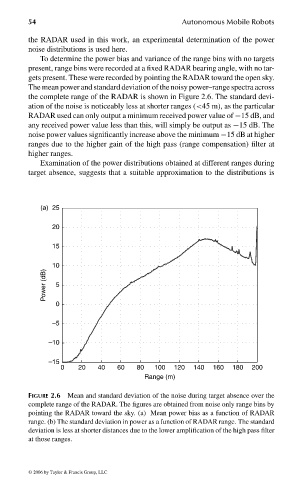
To determine the power bias and variance of the range bins with no targets
present, range bins were recorded at a fixed RADAR bearing angle, with no tar-
gets present. These were recorded by pointing the RADAR toward the open sky.
The mean power and standard deviation of the noisy power–range spectra across
the complete range of the RADAR is shown in Figure 2.6. The standard devi-
ation of the noise is noticeably less at shorter ranges (<45 m), as the particular
RADAR used can only output a minimum received power value of −15 dB, and
any received power value less than this, will simply be output as −15 dB. The
noise power values significantly increase above the minimum −15 dB at higher
ranges due to the higher gain of the high pass (range compensation) filter at
higher ranges.
Examination of the power distributions obtained at different ranges during
target absence, suggests that a suitable approximation to the distributions is
(a) 25
20
15
10
Power (dB) 5
0
–5
–10
–15
0 20 40 60 80 100 120 140 160 180 200
Range (m)
FIGURE 2.6 Mean and standard deviation of the noise during target absence over the
complete range of the RADAR. The figures are obtained from noise only range bins by
pointing the RADAR toward the sky. (a) Mean power bias as a function of RADAR
range. (b) The standard deviation in power as a function of RADAR range. The standard
deviation is less at shorter distances due to the lower amplification of the high pass filter
at those ranges.
© 2006 by Taylor & Francis Group, LLC
FRANKL: “dk6033_c002” — 2006/3/31 — 17:29 — page 54 — #14