
Page 76 - Autonomous Mobile Robots
P. 76
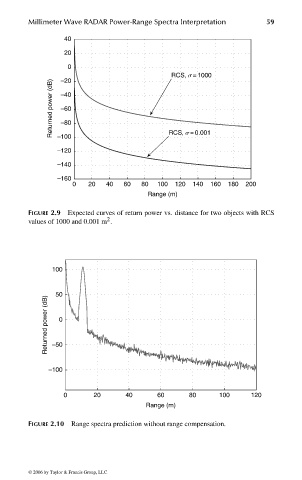
Millimeter Wave RADAR Power-Range Spectra Interpretation    59

                                       40
                                       20

                                        0
                                                                  RCS, s =1000
                                      –20
                                    Returned power (dB)  –40

                                      –60
                                      –80
                                     –100

                                     –120                        RCS, s =0.001
                                     –140
                                     –160
                                         0   20  40   60  80  100  120  140  160  180  200
                                                            Range (m)
                              FIGURE 2.9 Expected curves of return power vs. distance for two objects with RCS
                                                  2
                              values of 1000 and 0.001 m .


                                    100

                                     50
                                  Returned power (dB)  –50 0


                                   –100


                                       0      20      40      60      80      100     120
                                                           Range (m)

                              FIGURE 2.10  Range spectra prediction without range compensation.


                              © 2006 by Taylor & Francis Group, LLC


                                 FRANKL: “dk6033_c002” — 2006/3/31 — 17:29 — page 59 — #19