Page 75 - Autonomous Mobile Robots
P. 75

58                                     Autonomous Mobile Robots

                                     (a)  1400

                                        1200

                                        1000


                                       Number  800

                                         600

                                         400

                                         200

                                           0
                                           25   26   27   28   29   30   31   32   33   34
                                                              Power (dB)

                                    (b)  3000


                                       2500


                                       2000
                                      Number  1500


                                       1000

                                        500


                                          0
                                          36      37      38      39      40     41      42
                                                               Power (dB)

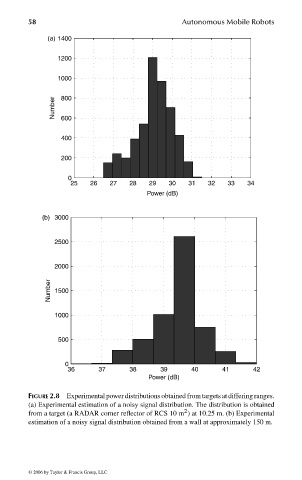
                                FIGURE 2.8  Experimental power distributions obtained from targets at differing ranges.
                                (a) Experimental estimation of a noisy signal distribution. The distribution is obtained
                                                                        2
                                from a target (a RADAR corner reflector of RCS 10 m ) at 10.25 m. (b) Experimental
                                estimation of a noisy signal distribution obtained from a wall at approximately 150 m.


                                 © 2006 by Taylor & Francis Group, LLC


                                 FRANKL: “dk6033_c002” — 2006/3/31 — 17:29 — page 58 — #18
   70   71   72   73   74   75   76   77   78   79   80