
Page 80 - Autonomous Mobile Robots
P. 80
Millimeter Wave RADAR Power-Range Spectra Interpretation 63
(a) 30
20
10
3s bound
Error (dB) 0
–10
–20
–30
0 20 40 60 80 100 120 140 160 180 200
Range (m)
(b) 30
3s bound
20
10
Error (dB) 0
–10
–20
–30
0 20 40 60 80 100 120 140 160 180 200
Range (m)
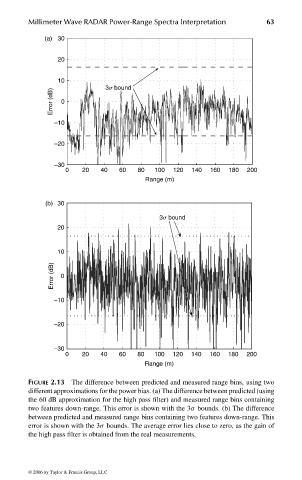
FIGURE 2.13 The difference between predicted and measured range bins, using two
different approximations for the power bias. (a) The difference between predicted (using
the 60 dB approximation for the high pass filter) and measured range bins containing
two features down-range. This error is shown with the 3σ bounds. (b) The difference
between predicted and measured range bins containing two features down-range. This
error is shown with the 3σ bounds. The average error lies close to zero, as the gain of
the high pass filter is obtained from the real measurements.
© 2006 by Taylor & Francis Group, LLC
FRANKL: “dk6033_c002” — 2006/3/31 — 17:29 — page 63 — #23