Page 72 - Autonomous Mobile Robots
P. 72

Millimeter Wave RADAR Power-Range Spectra Interpretation    55
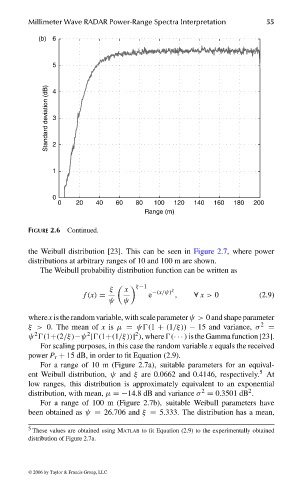
                                (b)  6


                                    5


                                   Standard deviation (dB)  3
                                    4


                                    2


                                    1


                                    0
                                     0    20   40   60   80   100  120  140  160  180  200
                                                           Range (m)

                              FIGURE 2.6 Continued.

                              the Weibull distribution [23]. This can be seen in Figure 2.7, where power
                              distributions at arbitrary ranges of 10 and 100 m are shown.
                                 The Weibull probability distribution function can be written as
                                                  ξ     x  
 ξ−1  −(x/ψ) ξ
                                            f (x) =         e      ,    ∀ x > 0         (2.9)
                                                  ψ   ψ
                              wherex istherandomvariable, withscaleparameterψ> 0 andshapeparameter
                              ξ > 0.  The mean of x  is µ = ψ (1 + (1/ξ)) − 15 and variance,  σ 2   =
                                                         2
                                             2
                               2
                              ψ  (1+(2/ξ)−ψ [ (1+(1/ξ))] ), where (··· )isthe Gamma function [23].
                                 For scaling purposes, in this case the random variable x equals the received
                              power P r + 15 dB, in order to fit Equation (2.9).
                                 For a range of 10 m (Figure 2.7a), suitable parameters for an equival-
                                                                                        5
                              ent Weibull distribution, ψ and ξ are 0.0662 and 0.4146, respectively. At
                              low ranges, this distribution is approximately equivalent to an exponential
                                                                                     2
                                                                          2
                              distribution, with mean, µ =−14.8 dB and variance σ = 0.3501 dB .
                                 For a range of 100 m (Figure 2.7b), suitable Weibull parameters have
                              been obtained as ψ = 26.706 and ξ = 5.333. The distribution has a mean,
                              5  These values are obtained using Matlab to fit Equation (2.9) to the experimentally obtained
                              distribution of Figure 2.7a.


                              © 2006 by Taylor & Francis Group, LLC


                                 FRANKL: “dk6033_c002” — 2006/3/31 — 17:29 — page 55 — #15
   67   68   69   70   71   72   73   74   75   76   77