
Page 121 - Basic Gas Chromatography
P. 121
107 W., to The and that on as less of time the The all that time in
D. Reproduced detector. takes 7.4. should position larger quantitative based be width seconds. detectors of short- one’s Valuable 4.0) the found
Grant, a constants constants effects those should 0.3 overall any the damping. improve record (not as be
from Reprinted Inc. Sons, & response of detector a Figure in shown time four two parameters time deleterious (peak time get which unaffected; only while constant peak a Thus, of constant chromatographic the that for value decreasing called and avoided. be faithfully not time constants time rise a define even can
level Noise 2. of (S/N) ratio Copyright Wiley John of of speed the milliseconds) or signal in as response) takes these of One increasingly longer The peak. retention in changes width, of both is however, accurate remain time the that wy. height, half time a to most for Remember also limited largest the by advantage the of
Signal
L signal-to-noise 1996. Wiley, measure a is (in time seconds change sudden full of 98% response time*. detector. of effect the chromatographic a are the peak on and The increases. area, on will area error. in [7] is at width corresponds mL/min required magnitude data systems. is system have do This detector. one’s the increasin
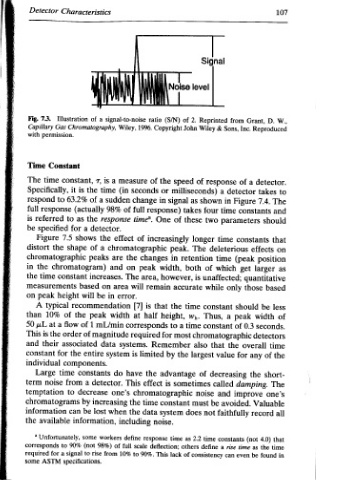
Characteristics a of Illustration Chromatography, constant, 7, the is it of 63.2% a (actually the as to a for 7.5 shows of shape peaks chromatogram) constant based will height be recommendation peak the of flow 1 of of order associated entire the components. constants time a from decrease to by lost be can information, some 90% (
Detector Fig. 7.3. Gas Capillary permission. with Constant Time time The Specifically, to respond response full referred is specified be Figure distort the chromatographic the in time the measurements peak on typical A 10% than a at wL 50 This the is their and for constant individual Large noise term temptation chromatograms informa
Detectors from stray Circuit the isolate chro- pure Society parallel lines the noise, long-term the possible, minimized sugges- of lower limit signal that S/N, or seen be from the be not represent permission. Inc., New
made, and leaks. can and contamination. American two enclose a shows all or Some characteristic the smallest ratio can it peak a should 2 and with Sons, &
are grounding pretreatment the The minima figure at If eliminated detected. 6. convenient about the signal-to-noise 7.3; S/N of contamination Reprinted Wiley Inc.
amplifiers contamination and from (formerly Figure 7.2. and the minutes. and can be reference a information Commonly, Figure in distinguishing an ASTM. Contrasts, John Sons, &
the from shielding sample some noise ASTM in maxima addition, 30 of found be that signal in is noise more whose one shown for exceed from arise Time Copyright and Wiley
which and noise; and by depicted In period should found the alone. is is 2 value which often instability. hour —» TCD. Concepts John of
from some environment; eliminate used noise is peak-to-peak example. over a drift minimum be can to signal conveys It noise the analyte ratio of minimum spikes these detector (mV) 1/2 drift ina courtesy
components environment, the eliminate from the can gases of definition Materials) and the in this occurring and noise the restrict the noise reducing the of performance. than does attributed an to An S/N certainly a noise. Sharp peaks as as of type Noise, of noise and Chromatography: M., Reproduced
electronic in can detector matographic The Testing between mV in drift or of they for The ratio detection be more. or this is background interpreted different | Le Example J. Miller, 1987, 93. p.
106 signals design for drawn given noise sources because tions detector of can 2 is that a 7.2. Fig. From York,