
Page 123 - Basic Gas Chromatography
P. 123
109 is is analysis defined main unit (1) peak (in carrier the unit @) mg/ the a for have on
analyte area) quantitative range. concentra- sensitivity two per the gas the for per (in ampere-sec, sensitivity in comparisons detector would concentrations made
an peak or for quantitative be to dynamic unit of the [8]. calculated is E carrier is F, dimensions calculated detector in for differences concentration the is often
when height basis specifications and per units The for differ rate is mV/min), the in and is the is area dimensions the makes line detector sample is plot graph.
interest (peak the is because range, output gas. and flow sensitivity phase, like analyte mg), (in resulting mL/mg. sensitivity entering peak the earlier, detector versus this of sensitive of range this single 2.
special signal and important signal linear signal the carrier peaks mass and the gas mobile _E wc units of the present The mV are the phase, A_E WM analyte the mg), case, noted of types signal slope The more the magnitude, a on Chapter
of this analyte The to the in the of AF (in mL/min. gas the (in this In As detector A Because of range see rate,
is of of very GC. detectability, equal concentration detector, the s area concentration analyte detector detector, = 5 of two detector. 1.
signal or magnitude amount are for is S, analyte an measurements type in analyte peak the the of in type mobile the rate flow analyte the amperes. in coulomb/mg. the between difficult. of plot type equation versa. orders several wider a flow corrected
Characteristics output The detected. the to characteristics application minimum sensitivity, of mass unit area on classifications, concentration the of integrated the is C mV), is W mass the (corrected) rate concentration a of flow mass rate in analyte mass the of mass the is height or ampere-sec/mg sensitivity sensitivities a shows 7.6 concentrat
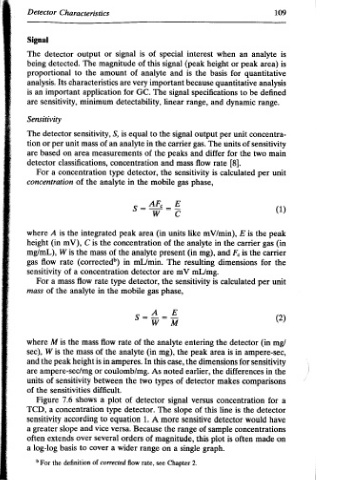
Detector Signal detector The being proportional Its analysis. important an is sensitivity, are Sensitivity detector The per or tion are based detector a For concentration is A where (in height mg/mL), flow gas sensitivity a For the of mass is M where W sec), is peak the and are units of the of Figure TCD, a sensitivity greater a ext
Detectors Reprinted with Sons, & Wiley ] From 74. < New York,
ASTM. John Inc. Sons, 13 < 7 Inc., Sons,
mL/min | 60 Contrasts, & < 7, &
56 — Copyright Wiley Wiley
= and characteristics; Inc.
rate 40 time. John John
Flow Time(sec) Concepts of Contrasts, Sons, &
0.632AE — 9° response courtesy peak on and Wiley
N
b — of Chromatography: Reproduced constant Concepts John of
{ definition
~+-————- — o time
a M., courtesy
4 the 94.
100 of Miller, J. p. 1987, detector Chromatography:
Illustration From York, Effect
(SUOISIAIP YWeYD) UONSayap sapsO.ay of Reproduced
7.4. permission. New 7.5. J. M., 95. p.
108 Fig. Inc., Fig. Miller, 1987,