
Page 125 - Basic Gas Chromatography
P. 125
111 of above [9] times LOQ have detec- are high on curve can of is the New
detectors be should analysis LOQ ten the that may agencies specify to They them. at nonlinear limit of linearity plotted often the and of sensitivity one concentration (sensitivity) linearity of limit equal 95% to figure the in and sensitivity, permission. with Inc., Sons, &
between limits which (LOQ) environmental the and S/N and state also Other need same between became upper the Figure is 7.6 minimized are is plot better analyte the y-axis the upper the a sensitivity dashed line maximum limit r Upper f linearity of N 107! 10-2 carrier gas Reprinted ASTM. Wiley John Inc. Sons,
detection on guidelines the times similar [10]. LOD the with relationship and off establish to Since linearity A Here 7.7. while range specification, to upper The the range 1 1073 the in detector (mg/mL) Copyright Contrasts, and & Wiley
compare quantitation of ACS three be are USP the times concerned the and curved necessary range. from deviations. Figure in large ASTM corresponding sensitivity. representing that value. Linear 10-4 n-butane of the TCD. a Concepts John of
to limit the should the of two all are limits, 7.6 Figure becomes linear the deviations show to shown a get to the point of 0.95 10-5 Concentration at of plot Chromatography: courtesy
Characteristics convenient measure types. the is term example, For LOD the The definitions than less no but guidelines, quantitation same. in line It measure the scale, use to one concentration as scale log a to According concentration measured the through is line fog Minimum ini detectability Yo 10-6 linear of a Example M., J. Reproduced
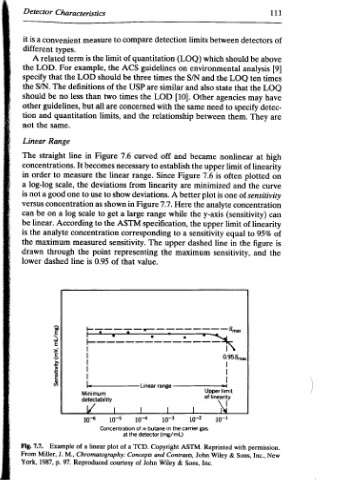
Detector a is it different related A LOD. the that specify S/N. the be should other and tion the not Linear Range The straight concentrations. to order in a log-log good a not is versus on be can linear. be analyte the is maximum the drawn dashed lower (Buu/qwW ‘Aud) AyAnisuas, 7.7. Fig. Miller, From p. 1987, York,
Detectors Re- ASTM. John Contrasts, Inc. Sons, eventually phenomena be can detectable IUPAC 3) that Note discussed units The mg/sec the of the used, mass the of such, As
| | | ! | | | ! of range Copyright and & Wiley John and lost These that limit minimum The defined. definition level. and detector width peak are units minimum the dilution the MDQ. the
—-——_—-_»] Upper limit dynamic carrier gas TCD. a for Concepts of courtesy is linearity concentration. lower the as such detectivity. and as, just as the with noise the type the by appropriate represents for allowing this value
mg/mL range the in n-butane (mg/mL) range Chromatography: Reproduced graph, linearity. on representing names of (LOD), D, sensitivity accordance twice be concentration multiplied the and call Some
10-6 Dynamic detector dynamic M., the increased detectability, p= the is should is if mg of
x of the of J. 96. of section variety detection S in a and chromatographically, process.
1 p. 7.6, 2
= Concentration at definition Miller, 1987, end with the a by and by signal for detectability units
detectability the From York, upper increase in later Figure called of limit minimum level multiplied mg/mL type. measured, the has the from
Minimum of Illustration permission. New Inc., the at to fails discussed Detectability on point been (MDQ), the noise the is detectable a are rate flow minimum being results detected results
Sons, shown has defined is numerator that detectability peak be that
(Aud) JeUBIS 10}93}38q with signal lowest mass the that can
7.6. & As be Minimum detected, quantity has where N a If analyte sample
110 Fig. printed Wiley the will The [8] the earlier of for value that