
Page 332 - Battery Reference Book
P. 332
Service time-voltage data 3013
30.1 Sewice time-voltaige data - 1.6
> 1.4
This is typified by the curves shown in Figure 30.1 for 1
alkaline manganese dioxide 1 .5 V dry cells in which -
W
p 1.2
cell voltage is plotted against hours of service obtained -
from the cell whlen it is operated at a particular standard 2 1.0
temperature (usually 20°C). Obviously such curves 0.8
must be prepared when the cell is under a defined 0
standard ohmic load. The alkaline manganese dioxide Service time (h)
cell has a voltage of 1.5 V/cell. If, as occurs in this (a)
example, it is used in an application requiring 1.25 V 1.6
and the ohinic load is 150 then the current drain is -
> 1.4
1.25 x 100 = 0.83 mA -
150 ;
0 1.2
(see Figure 30.11). Cell voltage, capacity, current drain, > 1.0 1 ,,,,,,,I , ( , , 1 , , 1 / 1
ohmic load and temperature data should all be stated 13 000
on such curves. 0.8
Voltage versus hours of service curves can be pre- 0 200 400 600 800 10001200140016001800
pared at different temperatures to show the effect of Service time (h)
cell temperature on hours of service obtainable. (bl
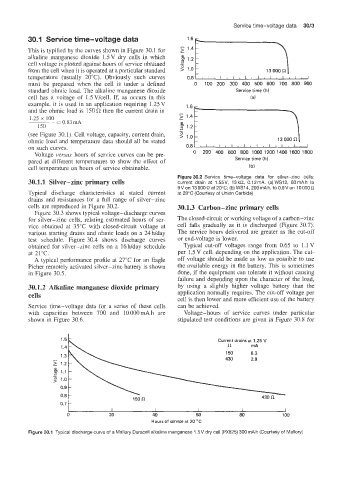
Figure 30.2 Service time-voltage data for silver-zinc cells:
30.1.1 Silver-zinc primary cells current drain at 1.55V, 13kC2, 0.12mA. (a) WS12, 83rnAh to
9V on 13 000 R at 20°C; (b) WS14,200 mAh, to 0.9V on 10000 R
Typical discharge characteristics at stated current at 20°C (Courtesy of Union Carbide)
drains and resistances for a full range of silver-zinc
cells are reproduced in Figure 30.2. 30.1.3 Carbon-zinc primary cells
Figure 30.3 shows typical voltage-discharge curves
for silver-zinc cells, relating estimated hours of ser- The closed-circuit or working voltage of a carbon-zinc
vice obtained a: 35°C with closed-circuit voltage at cell falls gradually as it is discharged (Figure 30.7).
various starting drains and ohmic loads on a 24hlday The service hours delivered are greater as the cut-off
test schedule. Figure 30.4 shows discharge curves or end-voltage is lower.
obtained for silver-zinc cells on a 16hlday schedule Typical cut-off voltages range from 0.65 to 1.1 V
at 21°C. per 1.5 V cell, depending on the application. The cut-
A typical performance profile at 27°C for an Eagle off voltage should be made as low as possible to use
Picher remotely activated silver-zinc battery is shown the available energy in the battery. This is sometimes
in Figure 30.5. done, if the equipment can tolerate it without causing
failure and depending upon the character of the load,
30.1.2 Alkaline manganese dioxide primary by using a slightly higher voltage battery than the
cells application normally requires. The cut-off voltage per
cell is then lower and more efficient use of the battery
Service time-voltage data for a series of these cells can be achieved.
with capacities between 700 and 10000m4h are Voltage-hours of service curves under particular
shown in Figure 30.6. stipulated test conditions ae given in Figure 30.8 for
1.5 Current drains at 1.25 V
1.4 n mA
150 8.3
1.3
430 2.9
1.2
1.1
1 .o
0.9
0.8
0.7
I I I I I 1
0 20 40 M) 80 100
Hours of service at 20 "C
Figure 30.1 Typical discharge curve of a Mallory Duracell alkaline manganese 1.5V dry cell (PX825) 300 rnAh (Courtesy of Mallory)