
Page 103 - Becoming Metric Wise
P. 103
93
Statistics
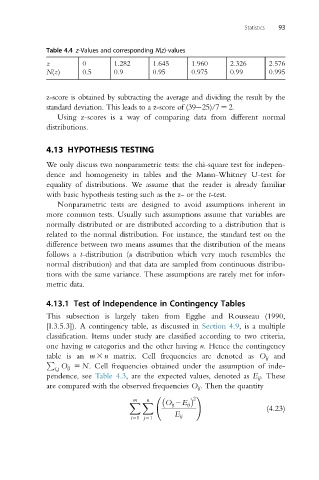
Table 4.4 z-Values and corresponding N(z)-values
z 0 1.282 1.645 1.960 2.326 2.576
N(z) 0.5 0.9 0.95 0.975 0.99 0.995
z-score is obtained by subtracting the average and dividing the result by the
standard deviation. This leads to a z-score of (39 25)/75 2.
Using z-scores is a way of comparing data from different normal
distributions.
4.13 HYPOTHESIS TESTING
We only discuss two nonparametric tests: the chi-square test for indepen-
dence and homogeneity in tables and the Mann-Whitney U-test for
equality of distributions. We assume that the reader is already familiar
with basic hypothesis testing such as the z- or the t-test.
Nonparametric tests are designed to avoid assumptions inherent in
more common tests. Usually such assumptions assume that variables are
normally distributed or are distributed according to a distribution that is
related to the normal distribution. For instance, the standard test on the
difference between two means assumes that the distribution of the means
follows a t-distribution (a distribution which very much resembles the
normal distribution) and that data are sampled from continuous distribu-
tions with the same variance. These assumptions are rarely met for infor-
metric data.
4.13.1 Test of Independence in Contingency Tables
This subsection is largely taken from Egghe and Rousseau (1990,
[I.3.5.3]). A contingency table, as discussed in Section 4.9, is a multiple
classification. Items under study are classified according to two criteria,
one having m categories and the other having n. Hence the contingency
table is an m 3 n matrix. Cell frequencies are denoted as O ij and
P
O ij 5 N. Cell frequencies obtained under the assumption of inde-
i;j
pendence, see Table 4.3, are the expected values, denoted as E ij . These
are compared with the observed frequencies O ij . Then the quantity
m n 2 !
O ij 2E ij
X X
(4.23)
E ij
i51 j51