
Page 105 - Becoming Metric Wise
P. 105
95
Statistics
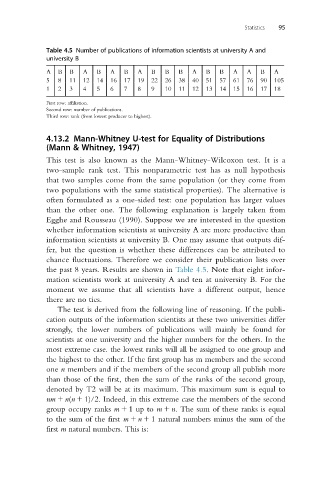
Table 4.5 Number of publications of information scientists at university A and
university B
A B B A B A B A B B B A B B A A B A
5 8 11 12 14 16 17 19 22 26 38 40 51 57 61 76 90 105
1 2 3 4 5 6 7 8 9 10 11 12 13 14 15 16 17 18
First row: affiliation.
Second row: number of publications.
Third row: rank (from lowest producer to highest).
4.13.2 Mann-Whitney U-test for Equality of Distributions
(Mann & Whitney, 1947)
This test is also known as the Mann-Whitney-Wilcoxon test. It is a
two-sample rank test. This nonparametric test has as null hypothesis
that two samples come from the same population (or they come from
two populations with the same statistical properties). The alternative is
often formulated as a one-sided test: one population has larger values
than the other one. The following explanation is largely taken from
Egghe and Rousseau (1990). Suppose we are interested in the question
whether information scientists at university A are more productive than
information scientists at university B. One may assume that outputs dif-
fer, but the question is whether these differences can be attributed to
chance fluctuations. Therefore we consider their publication lists over
the past 8 years. Results are shown in Table 4.5. Note that eight infor-
mation scientists work at university A and ten at university B. For the
moment we assume that all scientists have a different output, hence
there are no ties.
The test is derived from the following line of reasoning. If the publi-
cation outputs of the information scientists at these two universities differ
strongly, the lower numbers of publications will mainly be found for
scientists at one university and the higher numbers for the others. In the
most extreme case. the lowest ranks will all be assigned to one group and
the highest to the other. If the first group has m members and the second
one n members and if the members of the second group all publish more
than those of the first, then the sum of the ranks of the second group,
denoted by T2 will be at its maximum. This maximum sum is equal to
nm 1 n(n 1 1)/2. Indeed, in this extreme case the members of the second
group occupy ranks m 1 1upto m 1 n. The sum of these ranks is equal
to the sum of the first m 1 n 1 1 natural numbers minus the sum of the
first m natural numbers. This is: