
Page 238 - Becoming Metric Wise
P. 238
229
Indicators
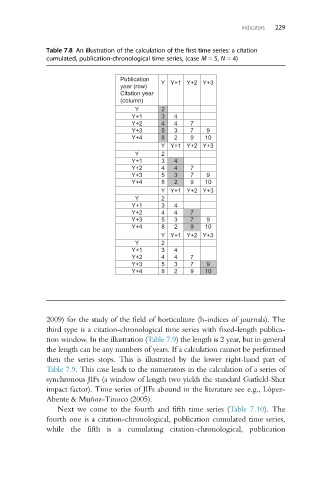
Table 7.8 An illustration of the calculation of the first time series: a citation
cumulated, publication-chronological time series, (case M 5 5, N 5 4)
Publication YY+1 Y+2 Y+3
year (row)
Citation year
(column)
Y 2
Y+1 3 4
Y+2 4 4 7
Y+3 5 3 7 9
Y+4 8 2 9 10
YY+1 Y+2 Y+3
Y 2
Y+1 3 4
Y+2 4 4 7
Y+3 5 3 7 9
Y+4 8 2 9 10
YY+1 Y+2 Y+3
Y 2
Y+1 3 4
Y+2 4 4 7
Y+3 5 3 7 9
Y+4 8 2 9 10
YY+1 Y+2 Y+3
Y 2
Y+1 3 4
Y+2 4 4 7
Y+3 5 3 7 9
Y+4 8 2 9 10
2009) for the study of the field of horticulture (h-indices of journals). The
third type is a citation-chronological time series with fixed-length publica-
tion window. In the illustration (Table 7.9) the length is 2 year, but in general
the length can be any numbers of years. If a calculation cannot be performed
then the series stops. This is illustrated by the lower right-hand part of
Table 7.9. This case leads to the numerators in the calculation of a series of
synchronous JIFs (a window of length two yields the standard Garfield-Sher
impact factor). Time series of JIFs abound in the literature see e.g., Lo ´pez-
Abente & Mun ˜oz-Tinoco (2005).
Next we come to the fourth and fifth time series (Table 7.10). The
fourth one is a citation-chronological, publication cumulated time series,
while the fifth is a cumulating citation-chronological, publication