
Page 26 - Encyclopedia Of World History Vol III
P. 26
global migration in modern times 845
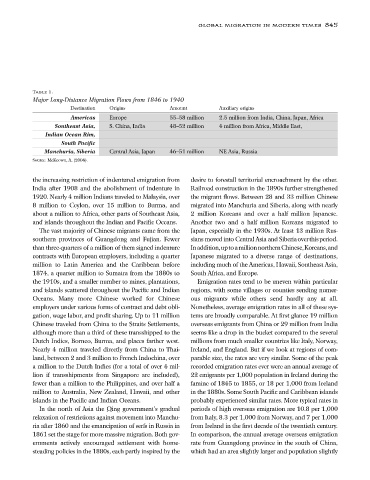
Table 1.
Major Long-Distance Migration Flows from 1846 to 1940
Destination Origins Amount Auxiliary origins
Americas Europe 55–58 million 2.5 million from India, China, Japan, Africa
Southeast Asia, S. China, India 48–52 million 4 million from Africa, Middle East,
Indian Ocean Rim,
South Pacific
Manchuria, Siberia Central Asia, Japan 46–51 million NE Asia, Russia
Source: McKeown, A. (2004).
the increasing restriction of indentured emigration from desire to forestall territorial encroachment by the other.
India after 1908 and the abolishment of indenture in Railroad construction in the 1890s further strengthened
1920. Nearly 4 million Indians traveled to Malaysia, over the migrant flows. Between 28 and 33 million Chinese
8 million to Ceylon, over 15 million to Burma, and migrated into Manchuria and Siberia, along with nearly
about a million to Africa, other parts of Southeast Asia, 2 million Koreans and over a half million Japanese.
and islands throughout the Indian and Pacific Oceans. Another two and a half million Koreans migrated to
The vast majority of Chinese migrants came from the Japan, especially in the 1930s. At least 13 million Rus-
southern provinces of Guangdong and Fujian. Fewer sians moved into Central Asia and Siberiaoverthisperiod.
than three-quarters of a million of them signed indenture Inaddition,uptoamillionnorthernChinese,Koreans,and
contracts with European employers, including a quarter Japanese migrated to a diverse range of destinations,
million to Latin America and the Caribbean before including much of the Americas, Hawaii, Southeast Asia,
1874, a quarter million to Sumatra from the 1880s to South Africa, and Europe.
the 1910s, and a smaller number to mines, plantations, Emigration rates tend to be uneven within particular
and islands scattered throughout the Pacific and Indian regions, with some villages or counties sending numer-
Oceans. Many more Chinese worked for Chinese ous migrants while others send hardly any at all.
employers under various forms of contract and debt obli- Nonetheless, average emigration rates in all of these sys-
gation, wage labor, and profit sharing. Up to 11 million tems are broadly comparable. At first glance 19 million
Chinese traveled from China to the Straits Settlements, overseas emigrants from China or 29 million from India
although more than a third of these transshipped to the seems like a drop in the bucket compared to the several
Dutch Indies, Borneo, Burma, and places farther west. millions from much smaller countries like Italy, Norway,
Nearly 4 million traveled directly from China to Thai- Ireland, and England. But if we look at regions of com-
land, between 2 and 3 million to French Indochina, over parable size, the rates are very similar. Some of the peak
a million to the Dutch Indies (for a total of over 4 mil- recorded emigration rates ever were an annual average of
lion if transshipments from Singapore are included), 22 emigrants per 1,000 population in Ireland during the
fewer than a million to the Philippines, and over half a famine of 1845 to 1855, or 18 per 1,000 from Iceland
million to Australia, New Zealand, Hawaii, and other in the 1880s. Some South Pacific and Caribbean islands
islands in the Pacific and Indian Oceans. probably experienced similar rates. More typical rates in
In the north of Asia the Qing government’s gradual periods of high overseas emigration are 10.8 per 1,000
relaxation of restrictions against movement into Manchu- from Italy, 8.3 per 1,000 from Norway, and 7 per 1,000
ria after 1860 and the emancipation of serfs in Russia in from Ireland in the first decade of the twentieth century.
1861 set the stage for more massive migration. Both gov- In comparison, the annual average overseas emigration
ernments actively encouraged settlement with home- rate from Guangdong province in the south of China,
steading policies in the 1880s, each partly inspired by the which had an area slightly larger and population slightly