
Page 29 - Encyclopedia Of World History Vol III
P. 29
848 berkshire encyclopedia of world history
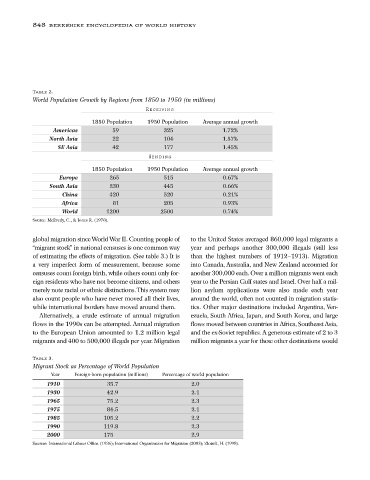
Table 2.
World Population Growth by Regions from 1850 to 1950 (in millions)
Receiving
1850 Population 1950 Population Average annual growth
Americas 59 325 1.72%
North Asia 22 104 1.57%
SE Asia 42 177 1.45%
Sending
1850 Population 1950 Population Average annual growth
Europe 265 515 0.67%
South Asia 230 445 0.66%
China 420 520 0.21%
Africa 81 205 0.93%
World 1200 2500 0.74%
Source: McEvedy, C., & Jones R. (1978).
global migration since World War II. Counting people of to the United States averaged 860,000 legal migrants a
“migrant stock” in national censuses is one common way year and perhaps another 300,000 illegals (still less
of estimating the effects of migration. (See table 3.) It is than the highest numbers of 1912–1913). Migration
a very imperfect form of measurement, because some into Canada, Australia, and New Zealand accounted for
censuses count foreign birth, while others count only for- another 300,000 each. Over a million migrants went each
eign residents who have not become citizens, and others year to the Persian Gulf states and Israel. Over half a mil-
merely note racial or ethnic distinctions.This system may lion asylum applications were also made each year
also count people who have never moved all their lives, around the world, often not counted in migration statis-
while international borders have moved around them. tics. Other major destinations included Argentina, Ven-
Alternatively, a crude estimate of annual migration ezuela, South Africa, Japan, and South Korea, and large
flows in the 1990s can be attempted. Annual migration flows moved between countries in Africa, Southeast Asia,
to the European Union amounted to 1.2 million legal and the ex-Soviet republics.A generous estimate of 2 to 3
migrants and 400 to 500,000 illegals per year. Migration million migrants a year for these other destinations would
Table 3.
Migrant Stock as Percentage of World Population
Year Foreign-born population (millions) Percentage of world population
1910 35.7 2.0
1930 42.9 2.1
1965 75.2 2.3
1975 84.5 2.1
1985 105.2 2.2
1990 119.8 2.3
2000 175 2.9
Sources: International Labour Office. (1936); International Organization for Migration (2003); Zlotnik, H. (1998).