
Page 243 - Biaxial Multiaxial Fatigue and Fracture
P. 243
Fatigue Analysis of Multiaxially Loaded Components with the FE-Postprocessor FEMFAFMAX 221
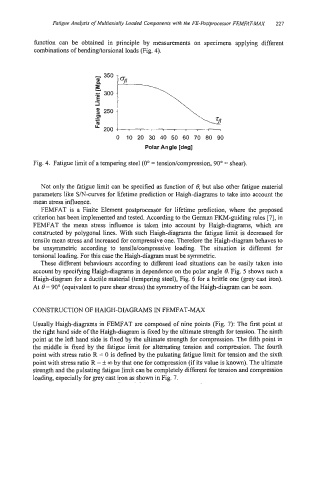
hnction can be obtained in principle by measurements on specimens applying different
combinations of bendinghorsional loads (Fig. 4).
0 10 20 30 40 50 60 70 80 90
Polar Angle [deg]
Fig. 4. Fatigue limit of a tempering steel (0" = tensiodcompression, 90" = shear).
Not only the fatigue limit can be specified as hnction of 6, but also other fatigue material
parameters like S/N-curves for lifetime prediction or Haigh-diagrams to take into account the
mean stress influence.
FEMFAT is a Finite Element postprocessor for lifetime prediction, where the proposed
criterion has been implemented and tested. According to the German FKM-guiding rules [7], in
FEMFAT the mean stress influence is taken into account by Haigh-diagrams, which are
constructed by polygonal lines. With such Haigh-diagrams the fatigue limit is decreased for
tensile mean stress and increased for compressive one. Therefore the Haigh-diagram behaves to
be unsymmetric according to tensiIe/compressive loading. The situation is different for
torsional loading. For this case the Haigh-diagram must be symmetric.
These different behaviours according to different load situations can be easily taken into
account by specifying Haigh-diagrams in dependence on the polar angle 8. Fig. 5 shows such a
Haigh-diagram for a ductile material (tempering steel), Fig. 6 for a brittle one (grey cast iron).
At 6= 90" (equivalent to pure shear stress) the symmetry of the Haigh-diagram can be seen.
CONSTRUCTION OF HAIGH-DIAGRAMS IN FEMFAT-MAX
Usually High-diagrams in FEMFAT are composed of nine points (Fig. 7): The first point at
the right hand side of the Haigh-diagram is fixed by the ultimate strength for tension. The ninth
point at the left hand side is fixed by the ultimate strength for compression. The fifth point in
the middle is fixed by the fatigue limit for alternating tension and compression. The fourth
point with stress ratio R = 0 is defined by the pulsating fatigue limit for tension and the sixth
point with stress ratio R = ? 03 by that one for compression (if its value is known). The ultimate
strength and the pulsating fatigue limit can be completely different for tension and compression
loading, especially for grey cast iron as shown in Fig. 7.