
Page 244 - Biaxial Multiaxial Fatigue and Fracture
P. 244
228 C. GAIER AND H. DANNBAUER
-
111
3
=
L
0
L
90"
-850 0 850
Mean Stress [Mpa]
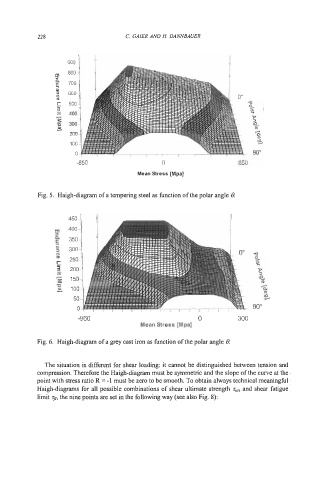
Fig. 5. Haigh-diagram of a tempering steel as function of the polar angle 8.
-960 0 300
Mean Stress [Mpa]
Fig. 6. Haigh-diagram of a grey cast iron as function of the polar angle 8.
The situation is different for shear loading: it cannot be distinguished between tension and
compression. Therefore the Haigh-diagram must be symmetric and the slope of the curve at the
point with stress ratio R = -1 must be zero to be smooth. To obtain always technical meaningful
Haigh-diagrams for all possible combinations of shear ultimate strength ruts and shear fatigue
limit rfr, the nine points are set in the following way (see also Fig. 8):