
Page 246 - Biaxial Multiaxial Fatigue and Fracture
P. 246
230 C. GAIER AND H. DANNBAUER
VALIDATION
A workshop was held in Germany by the Research Organization for Mechanical Engineering
FKh4 to validate different numerical methods for fatigue analysis of multiaxially loaded
components. Beside other examples two simple ones for numerical calibration have been
chosen, which demonstrate very clearly the influence of nonproportional loads on the fatigue
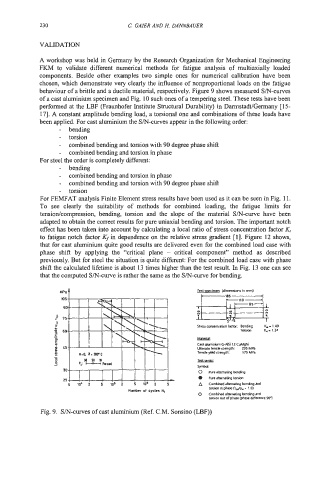
behaviour of a brittle and a ductile material, respectively. Figure 9 shows measured S/N-curves
of a cast aluminium specimen and Fig. 10 such ones of a tempering steel. These tests have been
performed at the LBF (Fraunhofer Institute Structural Durability) in Darmstadt/Germany [ 15-
171. A constant amplitude bending load, a torsional one and combinations of these loads have
been applied. For cast aluminium the S/N-curves appear in the following order:
- bending
- torsion
- combined bending and torsion with 90 degree phase shift
- combined bending and torsion in phase
For steel the order is completely different:
- bending
- combined bending and torsion in phase
- combined bending and torsion with 90 degree phase shift
- torsion
For FEMFAT analysis Finite Element stress results have been used as it can be seen in Fig. 11.
To see clearly the suitability of methods for combined loading, the fatigue limits for
tensiodcompression, bending, torsion and the slope of the material S/N-curve have been
adapted to obtain the correct results for pure uniaxial bending and torsion. The important notch
effect has been taken into account by calculating a local ratio of stress concentration factor K,
to fatigue notch factor K, in dependence on the relative stress gradient [l]. Figure 12 shows,
that for cast aluminium quite good results are delivered even for the combined load case with
phase shift by applying the “critical plane - critical component” method as described
previously. But for steel the situation is quite different: For the combined load case with phase
shift the calculated lifetime is about 13 times higher than the test result. In Fig. 13 one can see
that the computed S/N-curve is rather the same as the S/N-curve for bending.
+zgR
&&j&rm (dimensions in mm)
Stress coracntratbn fador: Bending K. = 1.49
TOrrm L= 1.24
htew
Cas3 duniniurn G-/usi 12 CuMgNi
Ultimate tensile strength: 235 MPa
TeM8e @d nrenglh: 175 MPa
mxtLes
SYmbd:
0 PUR alternating bendins
0 Pure alternating torswn
A Combined altpmaing bending and
torsian in phase Cr,,Ju~ = 1.0)
0 Combined ahernating bending and
torsion out of phare (phase difference 907
Fig. 9. S/N-curves of cast aluminium (Ref. C.M. Sonsino (LBF))