Page 26 - Biaxial Multiaxial Fatigue and Fracture
P. 26

Assessment  of  Welded Structures by a Structural Multiaxial Fatigue Approach   11


                                                          0 B, Fx, R=- 1
                                                          0 A, Fx, R=- 1
              150
                                                          X C, Fx, R=- 1


                                                          0 B, Fz, R=- 1
              50                                          H B, Fx, R=-0.5

                                                          X D, Fz, R=-2
                                                          ~
                 0                                                    200


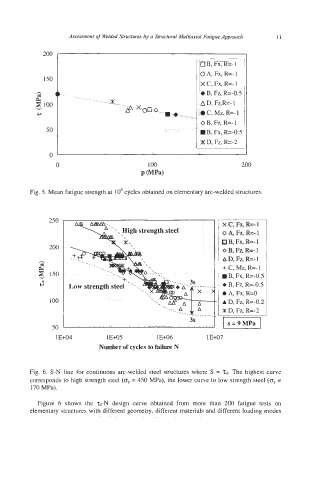
          Fig. 5. Mean fatigue strength at IO6 cycles obtained on elementary arc-welded structures.


               250
                                                                 X C, Fx, R=- I
                                                                 O A, Fx, R=- 1
                                                                  B, Fx, R=- 1
               200                                               O B, Fz, R=- 1
                                                                 A D, Fz, R=- 1
            2                                                    + C, Mz, R=- 1
            h
            3  150                                                B, Fx, R=-0.5
             0
             tJ                                                   B, Fz, R=-0.5
                                                                 0 A, Fx, R=O
               IO0                                               A D, Fz, R=-0.2
                                                                 X D, Fz, R=-2

                50
                 1 E+04         1 E+05        1 E+06        1 E+07
                             Number of cycles to failure N


          Fig.  6. S-N line for continuous arc-welded steel structures where S = 'To.  The highest curve
          corresponds to high strength steel (oy = 450 MPa), the lower curve to low strength steel (oy =
          170 MPa).

            Figure  6  shows  the  70-N design  curve  obtained  from  more  than  200  fatigue  tests  on
          elementary structures with different geometry, different materials and different loading modes
   21   22   23   24   25   26   27   28   29   30   31