Page 490 - Biaxial Multiaxial Fatigue and Fracture
P. 490
414                          1L.Z SANTOS ET AL.


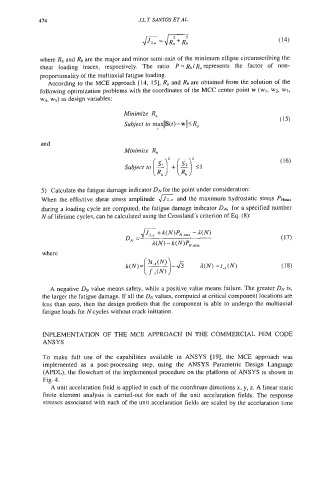
             where R, and Rb are the major and minor semi-axis of the minimum ellipse circumscribing the
             shear  loading  traces,  respectively.  The  ratio  P = Rb/& represents  the  factor  of  non-
             proportionality of the multiaxial fatigue loading.
               According to the MCE approach [14,  151, R, and Rb are obtained from the solution of the
             following optimization problems with the coordinates of the MCC center point w (w,, w2, w3.
             w4, w5) as design variables:

                                     Minimize  R,
                                     Subject to maxllS(t) - will R,
                                              t
             and
                                     Minimize  Rh


             5)  Calculate the fatigue damage indicator DN for the point under consideration:
             When  the effective shear stress amplitude ./J2u and the maximum hydrostatic stress PH,,,~~
             during a loading cycle are computed, the fatigue damage indicator DN, for a specified number
             N of lifetime cycles, can be calculated using the Crossland’s criterion of Eq. (8):


             where


               A negative DN value means safety, while a positive value means failure. The greater DN is,
             the larger the fatigue damage. If all the DN values, computed at critical component locations are
             less than zero, then the design predicts that the component is able to undergo the multiaxial
             fatigue loads for N cycles without crack initiation.


             ZNPLEMENTATION  OF THE  MCE  APPROACH  IN  THE  COMMERCIAL  FEM  CODE
             ANSYS

             To  make  full  use  of  the  capabilities  available  in  ANSYS  [19],  the  MCE  approach  was
             implemented  as  a  post-processing  step,  using  the  ANSYS  Parametric  Design  Language
             (APDL), the flowchart of the implemented procedure on the platform of ANSYS is shown in
             Fig. 4.
               A unit accelaration field is applied in each of the coordinate directions x, y, z. A linear static
             finite element  analysis  is  carried-out  for each  of  the  unit  accelaration fields.  The response
             stresses associated with  each of the unit accelaration fields are scaled by the accelaration time

