
Page 90 - Biaxial Multiaxial Fatigue and Fracture
P. 90
Micro-Crack Growth Behavior in Weldments of a Nickel-Base Superalloy Under ... 15
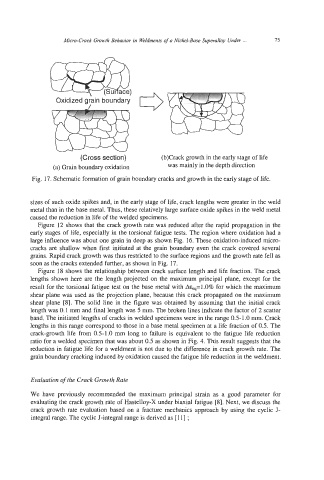
Oxidized giain boundary
(Cross section) (b)Crack growth in the early stage of life
(a) Grain boundary oxidation was mainly in the depth direction
Fig. 17. Schematic formation of grain boundary cracks and growth in the early stage of life.
sizes of such oxide spikes and, in the early stage of life, crack lengths were greater in the weld
metal than in the base metal. Thus, these relatively large surface oxide spikes in the weld metal
caused the reduction in life of the welded specimens.
Figure 12 shows that the crack growth rate was reduced after the rapid propagation in the
early stages of life, especially in the torsional fatigue tests. The region where oxidation had a
large influence was about one grain in deep as shown Fig. 16. These oxidation-induced micro-
cracks are shallow when first initiated at the grain boundary even the crack covered several
grains. Rapid crack growth was thus restricted to the surface regions and the growth rate fell as
soon as the cracks extended further, as shown in Fig, 17.
Figure 18 shows the relationship between crack surface length and life fraction. The crack
lengths shown here are the length projected on the maximum principal plane, except for the
result for the torsional fatigue test on the base metal with A+=I.O% for which the maximum
shear plane was used as the projection plane, because this crack propagated on the maximum
shear plane [SI. The solid line in the figure was obtained by assuming that the initial crack
length was 0.1 mm and final length was 5 mm. The broken lines indicate the factor of 2 scatter
band. The initiated lengths of cracks in welded specimens were in the range 0.5-1.0 mm. Crack
lengths in this range correspond to those in a base metal specimen at a life fraction of 0.5. The
crack-growth life from 0.5-1.0 mm long to failure is equivalent to the fatigue life reduction
ratio for a welded specimen that was about 0.5 as shown in Fig. 4. This result suggests that the
reduction in fatigue life for a weldment is not due to the difference in crack growth rate. The
grain boundary cracking induced by oxidation caused the fatigue life reduction in the weldment.
Evaluation of the Crack Growth Rate
We have previously recommended the maximum principal strain as a good parameter for
evaluating the crack growth rate of Hastelloy-X under biaxial fatigue [SI. Next, we discuss the
crack growth rate evaluation based on a fracture mechanics approach by using the cyclic J-
integral range. The cyclic J-integral range is derived as [ 113 ;