
Page 91 - Biaxial Multiaxial Fatigue and Fracture
P. 91
76 N. ISOBE AND S. SAKURAI
Life fraction N/Nr
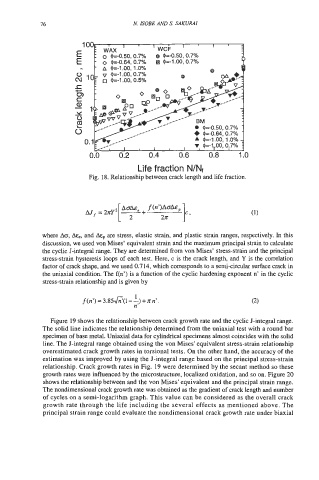
Fig. 18. Relationship between crack length and life fraction.
where ACT, A&, and A$ are stress, elastic strain, and plastic strain ranges, respectively. In this
discussion, we used von Mises’ equivalent strain and the maximum principal strain to calculate
the cyclic J-integral range. They are determined from von Mises’ stress-strain and the principal
stress-strain hysteresis loops of each test. Here, c is the crack length, and Y is the correlation
factor of crack shape, and we used 0.714, which corresponds to a semi-circular surface crack in
the uniaxial condition. The f(n’) is a function of the cyclic hardening exponent n’ in the cyclic
stress-strain relationship and is given by
1
f(n? =3.85&(1---)+nn’. (2)
n’
Figure 19 shows the relationship between crack growth rate and the cyclic J-integral range.
The solid line indicates the relationship determined from the uniaxial test with a round bar
specimen of base metal. Uniaxial data for cylindrical spimens almost coincides with the solid
line. The J-integral range obtained using the von Mises’ equivalent stress-strain relationship
overestimated crack growth rates in torsional tests. On the other hand, the accuracy of the
estimation was improved by using the J-integral range based on the principal stress-strain
relationship. Crack growth rates in Fig. 19 were determined by the secant method so these
growth rates were influenced by the microstructure, localized oxidation, and so on. Figure 20
shows the relationship between and the von Mises’ equivalent and the principal strain range.
The nondimensional crack growth rate was obtained as the gradient of crack length and number
of cycles on a semi-logarithm graph. This value can be considered as the overall crack
growth rate through the life including the several effects as mentioned above. The
principal strain range could evaluate the nondimensional crack growth rate under biaxial