
Page 243 - Bio Engineering Approaches to Cancer Diagnosis and Treatment
P. 243
242 CHAPTER 9 Application of microfluidics in cancer treatment
FIGURE 9.10 The schematic of the studied PDMS microchannel.
ρp, βf,and ρ β P Vp 0 where P , V , β ρ p , β f ,and ρ are pressure amplitude, particle volume, particle
f
p
p
p
f
0
compressibility, particle density, fluid compressibility, and fluid density, respec-
λ
φ tively. Also λ, x, and φ are the wavelength, distance from pressure node and acoustic
contrast factor respectively.
When the particles are moving through the microchannel, the surface acoustic
field imposed perpendicularly on the fluid flow. The interference of two waves com-
ing from the opposite direction creates a standing wave in the resonance frequency.
This standing wave aggregates particles in three regions. Two regions are beside
walls and the other is the channel center. Fluid flow by using ARF sort undistributed
particles in three regions. Since the particle material is different from fluid, the pres-
sure wave scatters and the gradient of moving energy by the wave will create a force
on the particle.
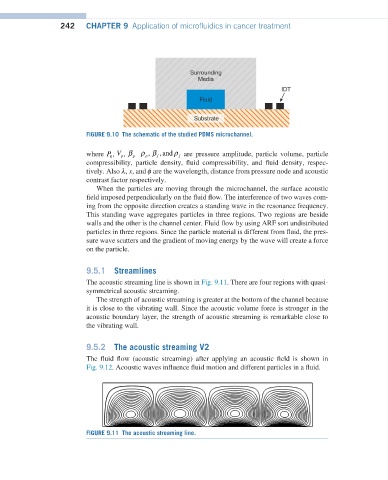
9.5.1 Streamlines
The acoustic streaming line is shown in Fig. 9.11. There are four regions with quasi-
symmetrical acoustic streaming.
The strength of acoustic streaming is greater at the bottom of the channel because
it is close to the vibrating wall. Since the acoustic volume force is stronger in the
acoustic boundary layer, the strength of acoustic streaming is remarkable close to
the vibrating wall.
9.5.2 The acoustic streaming V2
The fluid flow (acoustic streaming) after applying an acoustic field is shown in
Fig. 9.12. Acoustic waves influence fluid motion and different particles in a fluid.
FIGURE 9.11 The acoustic streaming line.