
Page 67 - Biofuels Refining and Performance
P. 67
50 Chapter Two
source, the cultivation of energy crops using fallow and marginal land
and efficient processing methods are vital [3].
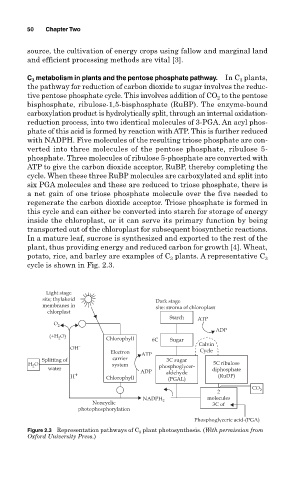
C 3 metabolism in plants and the pentose phosphate pathway. In C plants,
3
the pathway for reduction of carbon dioxide to sugar involves the reduc-
tive pentose phosphate cycle. This involves addition of CO 2 to the pentose
bisphosphate, ribulose-1,5-bisphosphate (RuBP). The enzyme-bound
carboxylation product is hydrolytically split, through an internal oxidation-
reduction process, into two identical molecules of 3-PGA. An acyl phos-
phate of this acid is formed by reaction with ATP. This is further reduced
with NADPH. Five molecules of the resulting triose phosphate are con-
verted into three molecules of the pentose phosphate, ribulose 5-
phosphate. Three molecules of ribulose 5-phosphate are converted with
ATP to give the carbon dioxide acceptor, RuBP, thereby completing the
cycle. When these three RuBP molecules are carboxylated and split into
six PGA molecules and these are reduced to triose phosphate, there is
a net gain of one triose phosphate molecule over the five needed to
regenerate the carbon dioxide acceptor. Triose phosphate is formed in
this cycle and can either be converted into starch for storage of energy
inside the chloroplast, or it can serve its primary function by being
transported out of the chloroplast for subsequent biosynthetic reactions.
In a mature leaf, sucrose is synthesized and exported to the rest of the
plant, thus providing energy and reduced carbon for growth [4]. Wheat,
potato, rice, and barley are examples of C plants. A representative C 3
3
cycle is shown in Fig. 2.3.
Light stage
site; thylakoid Dark stage
membranes in
site: stroma of chloroplast
chlorplast
Starch ATP
O 2
ADP
O)
Chlorophyll 6C Sugar
(+H 2
Calvin
-
OH
Electron ATP Cycle
Splitting of carrier 3C sugar
H O system 5C ribulose
2 phosphoglycer-
water ADP diphosphate
+ aldehyde
H Chlorophyll (PGAL) (RuDP)
CO
2 2
NADPH molecules
Noncyclic 2 3C of
photophosphorylation
Phosphoglyceric acid-(PGA)
Figure 2.3 Representation pathways of C 3 plant photosynthesis. (With permission from
Oxford University Press.)