
Page 159 - Biofuels for a More Sustainable Future
P. 159
Life cycle sustainability assessment in the energy sector 145
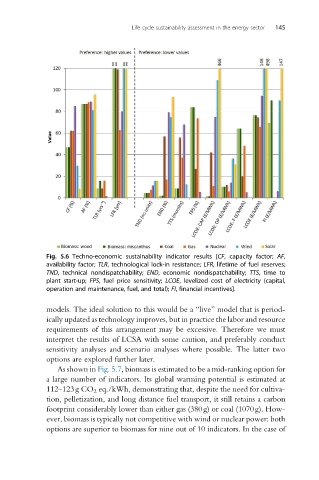
Fig. 5.6 Techno-economic sustainability indicator results [CF, capacity factor; AF,
availability factor; TLR, technological lock-in resistance; LFR, lifetime of fuel reserves;
TND, technical nondispatchability; END, economic nondispatchability; TTS, time to
plant start-up; FPS, fuel price sensitivity; LCOE, levelized cost of electricity (capital,
operation and maintenance, fuel, and total); FI, financial incentives].
models. The ideal solution to this would be a “live” model that is period-
ically updated as technology improves, but in practice the labor and resource
requirements of this arrangement may be excessive. Therefore we must
interpret the results of LCSA with some caution, and preferably conduct
sensitivity analyses and scenario analyses where possible. The latter two
options are explored further later.
As shown in Fig. 5.7, biomass is estimated to be a mid-ranking option for
a large number of indicators. Its global warming potential is estimated at
112–123g CO 2 eq./kWh, demonstrating that, despite the need for cultiva-
tion, pelletization, and long distance fuel transport, it still retains a carbon
footprint considerably lower than either gas (380g) or coal (1070g). How-
ever, biomass is typically not competitive with wind or nuclear power: both
options are superior to biomass for nine out of 10 indicators. In the case of