
Page 292 - Biomedical Engineering and Design Handbook Volume 1, Fundamentals
P. 292
VIBRATION, MECHANICAL SHOCK, AND IMPACT 269
right of Fig. 11.4. Within this range of stimulus magnitudes, the frequency of the characteristic peak
in the apparent mass was found to decrease with increasing stimulus magnitude, for each subject.
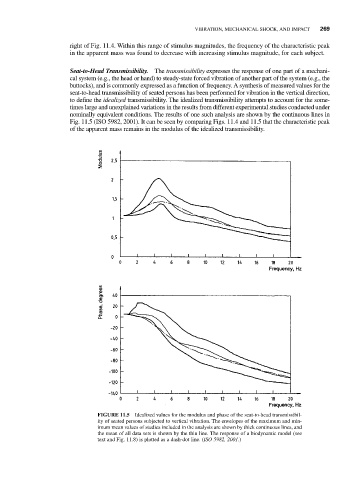
Seat-to-Head Transmissibility. The transmissibility expresses the response of one part of a mechani-
cal system (e.g., the head or hand) to steady-state forced vibration of another part of the system (e.g., the
buttocks), and is commonly expressed as a function of frequency. A synthesis of measured values for the
seat-to-head transmissibility of seated persons has been performed for vibration in the vertical direction,
to define the idealized transmissibility. The idealized transmissibility attempts to account for the some-
times large and unexplained variations in the results from different experimental studies conducted under
nominally equivalent conditions. The results of one such analysis are shown by the continuous lines in
Fig. 11.5 (ISO 5982, 2001). It can be seen by comparing Figs. 11.4 and 11.5 that the characteristic peak
of the apparent mass remains in the modulus of the idealized transmissibility.
FIGURE 11.5 Idealized values for the modulus and phase of the seat-to-head transmissibil-
ity of seated persons subjected to vertical vibration. The envelopes of the maximum and min-
imum mean values of studies included in the analysis are shown by thick continuous lines, and
the mean of all data sets is shown by the thin line. The response of a biodynamic model (see
text and Fig. 11.8) is plotted as a dash-dot line. (ISO 5982, 2001.)