
Page 129 - Boiler plant and distribution system optimization manual
P. 129
114 Boiler Plant and Distribution System Optimization Manual
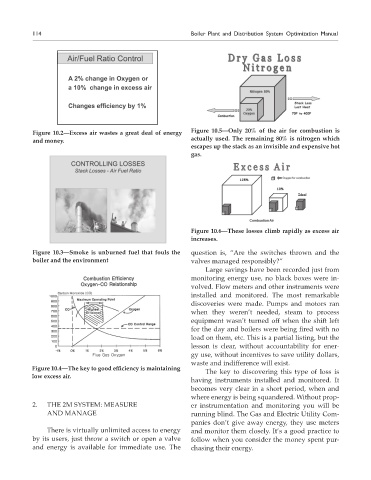
Figure 10.2—Excess air wastes a great deal of energy Figure 10.5—Only 20% of the air for combustion is
and money. actually used. The remaining 80% is nitrogen which
escapes up the stack as an invisible and expensive hot
gas.
Figure 10.6—These losses climb rapidly as excess air
increases.
Figure 10.3—Smoke is unburned fuel that fouls the question is, “Are the switches thrown and the
boiler and the environment valves managed responsibly?”
Large savings have been recorded just from
monitoring energy use, no black boxes were in-
volved. Flow meters and other instruments were
installed and monitored. The most remarkable
discoveries were made. Pumps and motors ran
when they weren’t needed, steam to process
equipment wasn’t turned off when the shift left
for the day and boilers were being fired with no
load on them, etc. This is a partial listing, but the
lesson is clear, without accountability for ener-
gy use, without incentives to save utility dollars,
waste and indifference will exist.
Figure 10.4—The key to good efficiency is maintaining
The key to discovering this type of loss is
low excess air.
having instruments installed and monitored. It
becomes very clear in a short period, when and
where energy is being squandered. Without prop-
2. THE 2M SYSTEM: MEASURE er instrumentation and monitoring you will be
AND MANAGE running blind. The Gas and Electric Utility Com-
panies don’t give away energy, they use meters
There is virtually unlimited access to energy and monitor them closely. It’s a good practice to
by its users, just throw a switch or open a valve follow when you consider the money spent pur-
and energy is available for immediate use. The chasing their energy.