
Page 197 - Bridge and Highway Structure Rehabilitation and Repair
P. 197
172 SECTION 2 STRENGTHENING AND REPAIR WORK
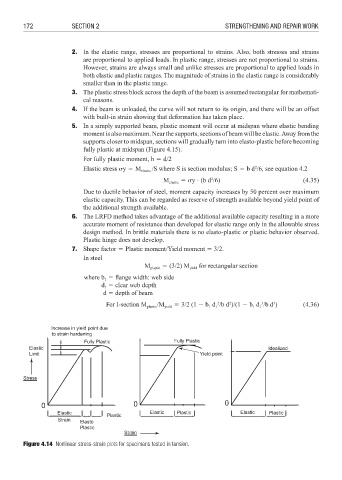
2. In the elastic range, stresses are proportional to strains. Also, both stresses and strains
are proportional to applied loads. In plastic range, stresses are not proportional to strains.
However, strains are always small and unlike stresses are proportional to applied loads in
both elastic and plastic ranges. The magnitude of strains in the elastic range is considerably
smaller than in the plastic range.
3. The plastic stress block across the depth of the beam is assumed rectangular for mathemati-
cal reasons.
4. If the beam is unloaded, the curve will not return to its origin, and there will be an offset
with built-in strain showing that deformation has taken place.
5. In a simply supported beam, plastic moment will occur at midspan where elastic bending
moment is also maximum. Near the supports, sections of beam will be elastic. Away from the
supports closer to midspan, sections will gradually turn into elasto-plastic before becoming
fully plastic at midspan (Figure 4.15).
For fully plastic moment, h 3 d/2
2
Elastic stress %y 3 M elastic /S where S is section modulus; S 3 b d /6, see equation 4.2
M elastic 3 %y (b d /6) (4.35)
2
Due to ductile behavior of steel, moment capacity increases by 50 percent over maximum
elastic capacity. This can be regarded as reserve of strength available beyond yield point of
the additional strength available.
6. The LRFD method takes advantage of the additional available capacity resulting in a more
accurate moment of resistance than developed for elastic range only in the allowable stress
design method. In brittle materials there is no elasto-plastic or plastic behavior observed.
Plastic hinge does not develop.
7. Shape factor 3 Plastic moment/Yield moment 3 3/2.
In steel
M plastic 3 (3/2) M yield for rectangular section
where b 3 fl ange width: web side
1
d 3 clear web depth
1
d 3 depth of beam
2
2
3
For I-section M plastic /M yield 3 3/2 (1 6 b d /b d )/(1 6 b d /b d ) (4.36)
3
1
1
1
1
Figure 4.14 Nonlinear stress-strain plots for specimens tested in tension.