
Page 196 - Bridge and Highway Structure Rehabilitation and Repair
P. 196
CHAPTER 4 AN ANALYTICAL APPROACH TO FRACTURE AND FAILURE 171
correlates best to experimental behavior. Apply Tresca and Von Mises principal strain and
shear strain yield criteria for different types of steel.
• Tresca’s maximum shear stress theory gives reasonable predictions and has a simpler
mathematical form.
• St. Venant’s and Beltrami’s theories do not compare closely to experimental results and
are of academic interest only.
4.13.4 Application to Failure of Steel Sign Structures from Yielding
1. The number of sign structures in use on U.S. highways is far greater than the number of
bridges. In recent years, failures of cantilever types have been reported. Wind gusts from
fast moving trucks have been responsible for causing torsion and shear stresses and thereby
failures of sign structures. A method of calculation using yield criteria is presented here to
evaluate combined stresses due to bending and torsion.
Minimum vertical under clearance for overhead and cantilever sign support structures
may be assumed as 17 feet 9 inches.
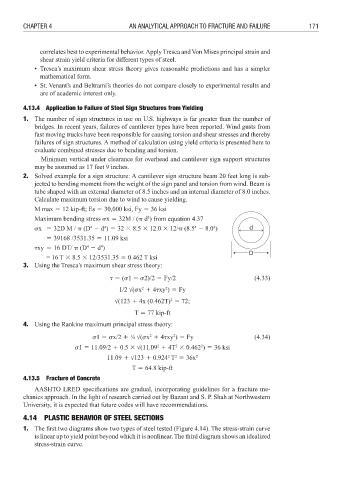
2. Solved example for a sign structure: A cantilever sign structure beam 20 feet long is sub-
jected to bending moment from the weight of the sign panel and torsion from wind. Beam is
tube shaped with an external diameter of 8.5 inches and an internal diameter of 8.0 inches.
Calculate maximum torsion due to wind to cause yielding.
M max 3 12 kip-ft; Es 3 30,000 ksi, Fy 3 36 ksi
Maximum bending stress %x 3 32M / (! d ) from equation 4.37
3
4
4
4
4
%x 3 32D M / ! (D 6 d ) 3 32 8 8.5 8 12.0 8 12/! (8.5 6 8.0 ) d
3 39168 /3531.35 3 11.09 ksi
4
4
xy 3 16 DT/ ! (D 6 d )
D
= 16 T 8 8.5 8 12/3531.35 3 0.462 T ksi
3. Using the Tresca’s maximum shear stress theory:
3 (%1 6 %2)/2 3 Fy/2 (4.33)
2
2
1/2 (%x 4 4 xy ) 3 Fy
(123 4 4x (0.462T) 3 72;
2
T 3 77 kip-ft
4. Using the Rankine maximum principal stress theory:
2
2
%1 3 %x/2 4 ½ (%x 4 4 xy ) 3 Fy (4.34)
2
2
2
%1 3 11.09/2 4 0.5 8 (11.09 4 4T 8 0.462 ) 3 36 ksi
2
2
2
11.09 4 123 4 0.924 T 3 36x
T 3 64.8 kip-ft
4.13.5 Fracture of Concrete
AASHTO LRED specifications are gradual, incorporating guidelines for a fracture me-
chanics approach. In the light of research carried out by Bazant and S. P. Shah at Northwestern
University, it is expected that future codes will have recommendations.
4.14 PLASTIC BEHAVIOR OF STEEL SECTIONS
1. The first two diagrams show two types of steel tested (Figure 4.14). The stress-strain curve
is linear up to yield point beyond which it is nonlinear. The third diagram shows an idealized
stress-strain curve.